正在加载图片...
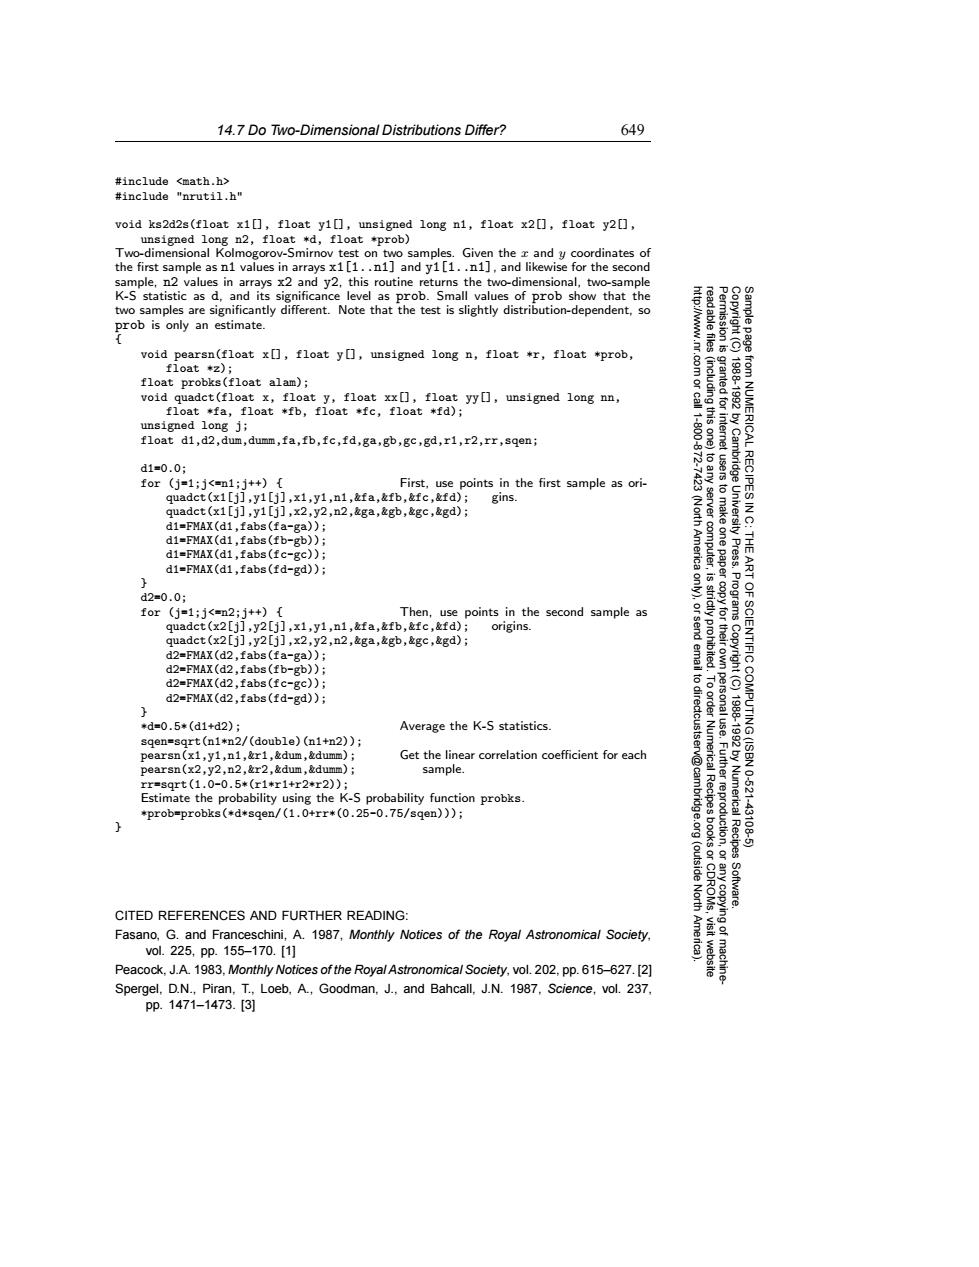
14.7 Do Two-Dimensional Distributions Differ? 649 #include <math.h> #include "nrutil.h" void ks2d2s(f1oatx10,f1oaty1☐,unsigned1ongn1,f1oatx2☐,f1oaty2[0, unsigned long n2,float *d,float *prob) Two-dimensional Kolmogorov-Smirnov test on two samples.Given the x and y coordinates of the first sample as n1 values in arrays x1[1..n1]and y1[1..n1],and likewise for the second sample,n2 values in arrays x2 and y2,this routine returns the two-dimensional,two-sample K-S statistic as d,and its significance level as prob.Small values of prob show that the two samples are significantly different.Note that the test is slightly distribution-dependent,so prob is only an estimate. void pearsn(float x[],float y[],unsigned long n,float *r,float +prob, 5常 float *z); float probks(float alam); void quadct(float x,float y,float xx[],float yy[],unsigned long nn, 18881892 float *fa,float *fb,float *fc,float *fd); unsigned long j; float di,d2,dum,dumm,fa,fb,fc,fd,ga,gb,gc,gd,r1,r2,rr,sqen; d1=0.0; from NUMERICAL RECIPES I for(j=1:j<=n1:j++){ First,use points in the first sample as ori- quadct(x1[j],y1[j],x1,y1,n1,&fa,&fb,&fc,&fd);gins. quadct (x1[j],y1[j],x2,y2,n2,&ga,&gb,&gc,&gd); d1=FMAX(d1,fabs(fa-ga)); d1=FMAX(d1,fabs(fb-gb)); d1=FMAX(d1,fabs(fc-gc)); computer, Americ Press. d1=FMAX(d1,fabs(fd-gd)); ART d2=0.0; for(j=1;j<=n2;j++)[ Then,use points in the second sample as Programs quadct(x2[j],y2[j],x1,y1,n1,&fa,&fb,&fc,&fd); origins. quadct(x2[j],y2[j],x2,y2,n2,&ga,&gb,&gc,&gd); d2=FMAX(d2,fabs(fa-ga)); SCIENTIFIC d2=FMAX(d2,fabs(fb-gb)); d2=FMAX(d2,fabs(fc-gc)); to dir d2=FMAX(d2,fabs(fd-gd)); *d=0.5*(d1+d2); Average the K-S statistics sqen=sqrt(n1*n2/(double)(n1+n2)); 198918920 COMPUTING(ISBN pearsn(x1,y1,n1,&r1,&dum,&dumm); Get the linear correlation coefficient for each pearsn(x2,y2,n2,&r2,&dum,&dumm); sample. rr=sqrt(1.0-0.5*(r1*r1+r2*r2)); Estimate the probability using the K-S probability function probks. *prob=probks(*d*sqen/(1.0+rr*(0.25-0.75/sqen))); Numerical Recipes -43108 (outside 膜 Software. CITED REFERENCES AND FURTHER READING: Fasano.G.and Franceschini,A.1987,Monthly Notices of the Royal Astronomical Society. Ame vol.225,Pp.155-170.[1] Peacock,J.A.1983,Monthly Notices of the Royal Astronomical Society,vol.202,pp.615-627.[2] Spergel,D.N.,Piran,T.,Loeb,A.,Goodman,J.,and Bahcall,J.N.1987,Science,vol.237. pp.1471-1473.314.7 Do Two-Dimensional Distributions Differ? 649 Permission is granted for internet users to make one paper copy for their own personal use. Further reproduction, or any copyin Copyright (C) 1988-1992 by Cambridge University Press. Programs Copyright (C) 1988-1992 by Numerical Recipes Software. Sample page from NUMERICAL RECIPES IN C: THE ART OF SCIENTIFIC COMPUTING (ISBN 0-521-43108-5) g of machinereadable files (including this one) to any server computer, is strictly prohibited. To order Numerical Recipes books or CDROMs, visit website http://www.nr.com or call 1-800-872-7423 (North America only), or send email to directcustserv@cambridge.org (outside North America). #include <math.h> #include "nrutil.h" void ks2d2s(float x1[], float y1[], unsigned long n1, float x2[], float y2[], unsigned long n2, float *d, float *prob) Two-dimensional Kolmogorov-Smirnov test on two samples. Given the x and y coordinates of the first sample as n1 values in arrays x1[1..n1] and y1[1..n1], and likewise for the second sample, n2 values in arrays x2 and y2, this routine returns the two-dimensional, two-sample K-S statistic as d, and its significance level as prob. Small values of prob show that the two samples are significantly different. Note that the test is slightly distribution-dependent, so prob is only an estimate. { void pearsn(float x[], float y[], unsigned long n, float *r, float *prob, float *z); float probks(float alam); void quadct(float x, float y, float xx[], float yy[], unsigned long nn, float *fa, float *fb, float *fc, float *fd); unsigned long j; float d1,d2,dum,dumm,fa,fb,fc,fd,ga,gb,gc,gd,r1,r2,rr,sqen; d1=0.0; for (j=1;j<=n1;j++) { First, use points in the first sample as oriquadct(x1[j],y1[j],x1,y1,n1,&fa,&fb,&fc,&fd); gins. quadct(x1[j],y1[j],x2,y2,n2,&ga,&gb,&gc,&gd); d1=FMAX(d1,fabs(fa-ga)); d1=FMAX(d1,fabs(fb-gb)); d1=FMAX(d1,fabs(fc-gc)); d1=FMAX(d1,fabs(fd-gd)); } d2=0.0; for (j=1;j<=n2;j++) { Then, use points in the second sample as quadct(x2[j],y2[j],x1,y1,n1,&fa,&fb,&fc,&fd); origins. quadct(x2[j],y2[j],x2,y2,n2,&ga,&gb,&gc,&gd); d2=FMAX(d2,fabs(fa-ga)); d2=FMAX(d2,fabs(fb-gb)); d2=FMAX(d2,fabs(fc-gc)); d2=FMAX(d2,fabs(fd-gd)); } *d=0.5*(d1+d2); Average the K-S statistics. sqen=sqrt(n1*n2/(double)(n1+n2)); pearsn(x1,y1,n1,&r1,&dum,&dumm); Get the linear correlation coefficient for each pearsn(x2,y2,n2,&r2,&dum,&dumm); sample. rr=sqrt(1.0-0.5*(r1*r1+r2*r2)); Estimate the probability using the K-S probability function probks. *prob=probks(*d*sqen/(1.0+rr*(0.25-0.75/sqen))); } CITED REFERENCES AND FURTHER READING: Fasano, G. and Franceschini, A. 1987, Monthly Notices of the Royal Astronomical Society, vol. 225, pp. 155–170. [1] Peacock, J.A. 1983, Monthly Notices of the Royal Astronomical Society, vol. 202, pp. 615–627. [2] Spergel, D.N., Piran, T., Loeb, A., Goodman, J., and Bahcall, J.N. 1987, Science, vol. 237, pp. 1471–1473. [3]