正在加载图片...
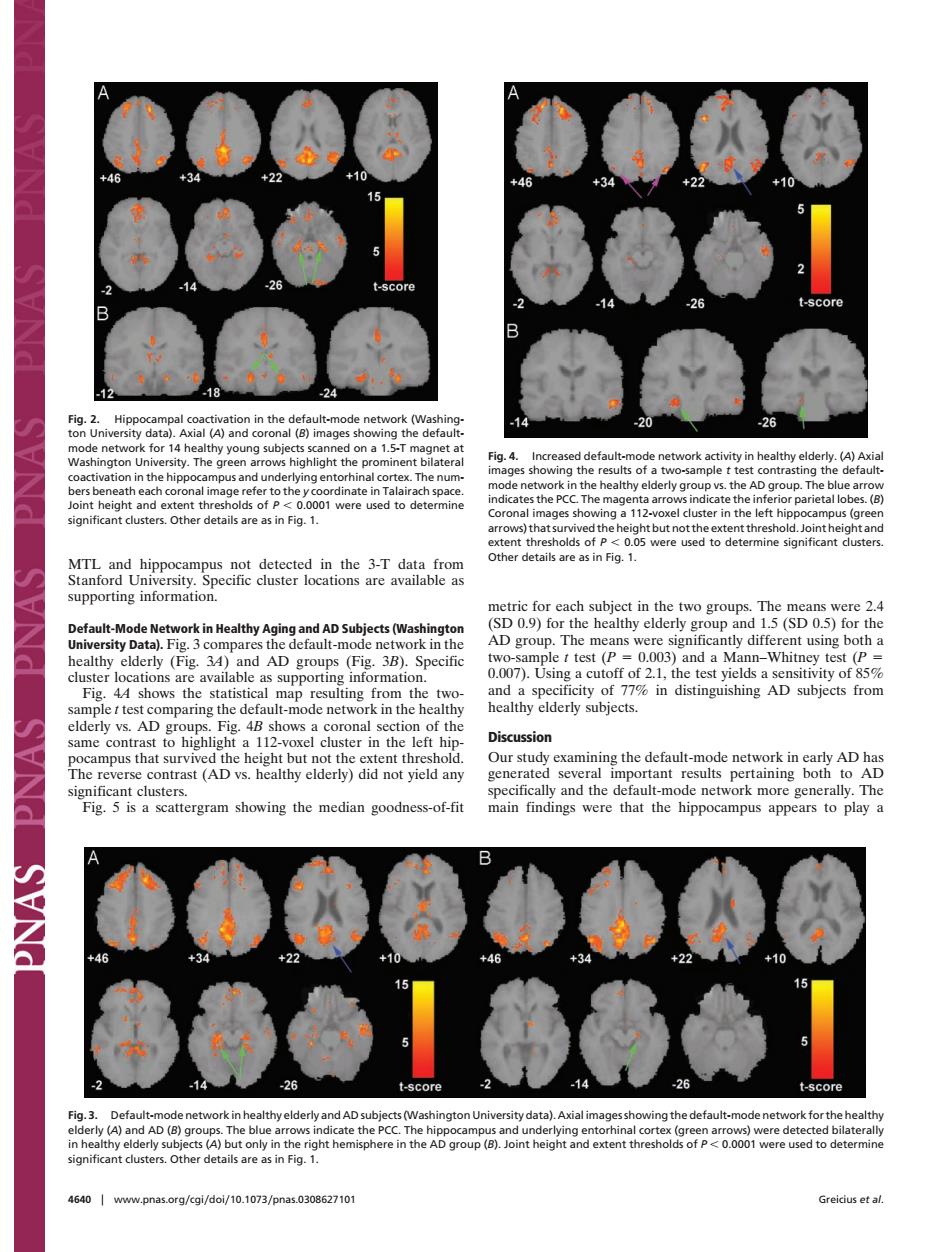
02 A)and mages sh default 315 Fig.4.Incre nd AD gro used Default-Mo or th sity D ta) mpar ult-m 07( and a M ions ng n ificity of 77%in distinguishing AD subjects from mparing the de o hi that a in the ontrast (AD vs.healthy elderly)did not yield any Fig.5is a scattergram showing the median goodness-of-fit main indings were that the hippocampus appears to play ngton Universi data).Axialimag ng the 4 AD IRY p(】 640 www.pnas.org/cgi/dol/10.1073/pnas.030862710 Greicius et al.MTL and hippocampus not detected in the 3-T data from Stanford University. Specific cluster locations are available as supporting information. Default-Mode Network in Healthy Aging and AD Subjects (Washington University Data). Fig. 3 compares the default-mode network in the healthy elderly (Fig. 3A) and AD groups (Fig. 3B). Specific cluster locations are available as supporting information. Fig. 4A shows the statistical map resulting from the twosample t test comparing the default-mode network in the healthy elderly vs. AD groups. Fig. 4B shows a coronal section of the same contrast to highlight a 112-voxel cluster in the left hippocampus that survived the height but not the extent threshold. The reverse contrast (AD vs. healthy elderly) did not yield any significant clusters. Fig. 5 is a scattergram showing the median goodness-of-fit metric for each subject in the two groups. The means were 2.4 (SD 0.9) for the healthy elderly group and 1.5 (SD 0.5) for the AD group. The means were significantly different using both a two-sample t test (P 0.003) and a Mann–Whitney test (P 0.007). Using a cutoff of 2.1, the test yields a sensitivity of 85% and a specificity of 77% in distinguishing AD subjects from healthy elderly subjects. Discussion Our study examining the default-mode network in early AD has generated several important results pertaining both to AD specifically and the default-mode network more generally. The main findings were that the hippocampus appears to play a Fig. 2. Hippocampal coactivation in the default-mode network (Washington University data). Axial (A) and coronal (B) images showing the defaultmode network for 14 healthy young subjects scanned on a 1.5-T magnet at Washington University. The green arrows highlight the prominent bilateral coactivation in the hippocampus and underlying entorhinal cortex. The numbers beneath each coronal image refer to the y coordinate in Talairach space. Joint height and extent thresholds of P 0.0001 were used to determine significant clusters. Other details are as in Fig. 1. Fig. 3. Default-mode network in healthy elderly and AD subjects (Washington University data). Axial images showing the default-mode network for the healthy elderly (A) and AD (B) groups. The blue arrows indicate the PCC. The hippocampus and underlying entorhinal cortex (green arrows) were detected bilaterally in healthy elderly subjects (A) but only in the right hemisphere in the AD group (B). Joint height and extent thresholds of P 0.0001 were used to determine significant clusters. Other details are as in Fig. 1. Fig. 4. Increased default-mode network activity in healthy elderly. (A) Axial images showing the results of a two-sample t test contrasting the defaultmode network in the healthy elderly group vs. the AD group. The blue arrow indicates the PCC. The magenta arrows indicate the inferior parietal lobes. (B) Coronal images showing a 112-voxel cluster in the left hippocampus (green arrows) that survived the height but not the extent threshold. Joint height and extent thresholds of P 0.05 were used to determine significant clusters. Other details are as in Fig. 1. 4640 www.pnas.orgcgidoi10.1073pnas.0308627101 Greicius et al.�������