正在加载图片...

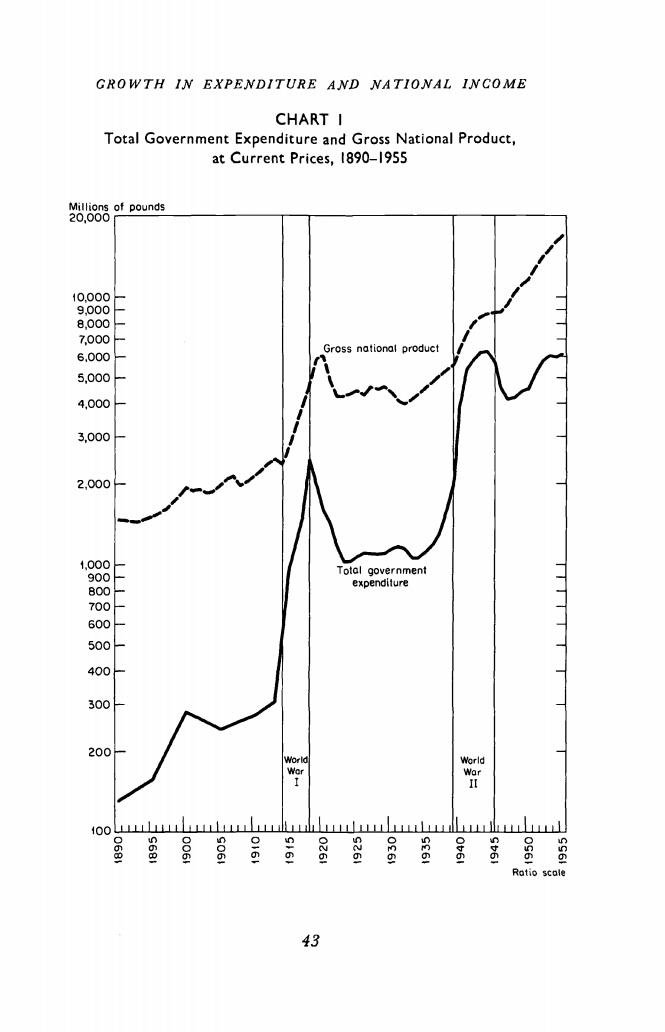
GROWTH IN EXPENDITURE AND NATIONAL INCOME CHART I Total Government Expenditure and Gross National Product, at Current Prices,1890-1955 28l8ptpound 5,000 400 300 2,00 20 00 43GROWTH IX EXPENDITURE AND NATiONAL INCOME CHART I Total Government Expenditure and Gross National Product, 10,000 9,000 8,000 7,000 6,000 5,000 4,000 3,000 2,000 1,000 900 800 700 600 500 400 300 200 100 at Current Prices, 43 1890— 1955 Ratio Millions of pounds 20,000 o 0 0 tfl 0 tfl 0 IC) 0 0 IC) o o - C'.j N U') — — — —