正在加载图片...
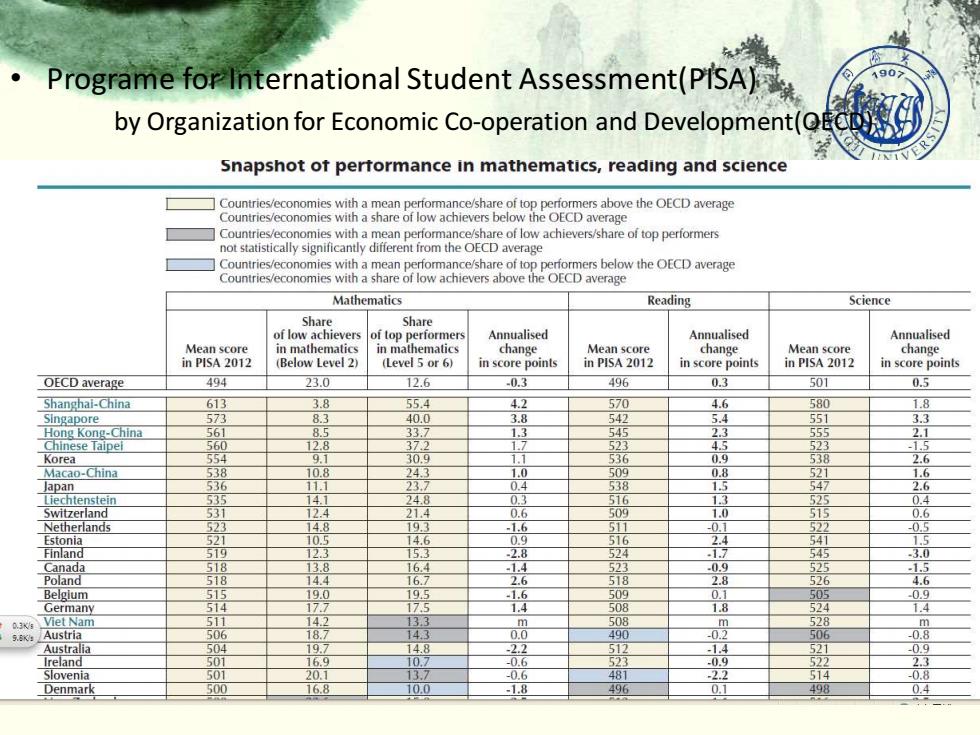
Programe for International Student Assessment(PISA) 90 by Organization for Economic Co-operation and Development Snapshot of pertormance in mathematics,reading and science Countries/economies with a mean performance/share of top performers above the OECD average Countries/economies with a share of low achievers below the OECD average Countries/economies with a mean performance/share of low achievers/share of top performers not statistically significantly different from the OECD average Countries/economies with a mean performance/share of top performers below the OECD average Countries/economies with a share of low achievers above the OECD average Mathematics Reading Science Share Share of low achievers of top performers Annualised Annualised Annualised Mean score in mathematics in mathematics change Mean score change Mean score change in PISA 2012 (Below Level 2) (Level 5 or 6) in score points in PISA 2012 in score points in PISA 2012 in score points OECD average 494 23.0 12.6 -0.3 496 0.3 501 0.5 Shanghai-China 613 3.8 55.4 4.2 570 46 580 1.8 573 8 40.0 3 542 5.4 551 3 Hone Kong-Chin 561 33.7 45 23 554 Chinese Taipel 56元 52 523 Korea 36 0.g 5 Macao-China 538 243 50 Japan 536 23. 38 2.6 Liechtenstein 535 4.1 24.8 0.3 516 1.3 525 0.4 Switzerland 531 24 21.4 0.6 509 1.0 515 0.6 Netherlands 14.8 19.3 .1.6 511 -0.1 -05 521 105 146 51 41 Finland 519 23 5 2.8 524 17 545 3.0 Canada Poland Belgium 515 95 -1.6 09 6 -0.9 Germany 514 7 1.4 508 18 524 1.4 511 42 33 508 528 506 18.7 0.0 490 -0.8 504 19.7 1.4 5 Slovenia 0.6 4 Denmark 16.8 0.0 18 496 498 0.4 http://www.oecd.org/pisa/ • Programe for International Student Assessment(PISA) by Organization for Economic Co-operation and Development(OECD)