正在加载图片...
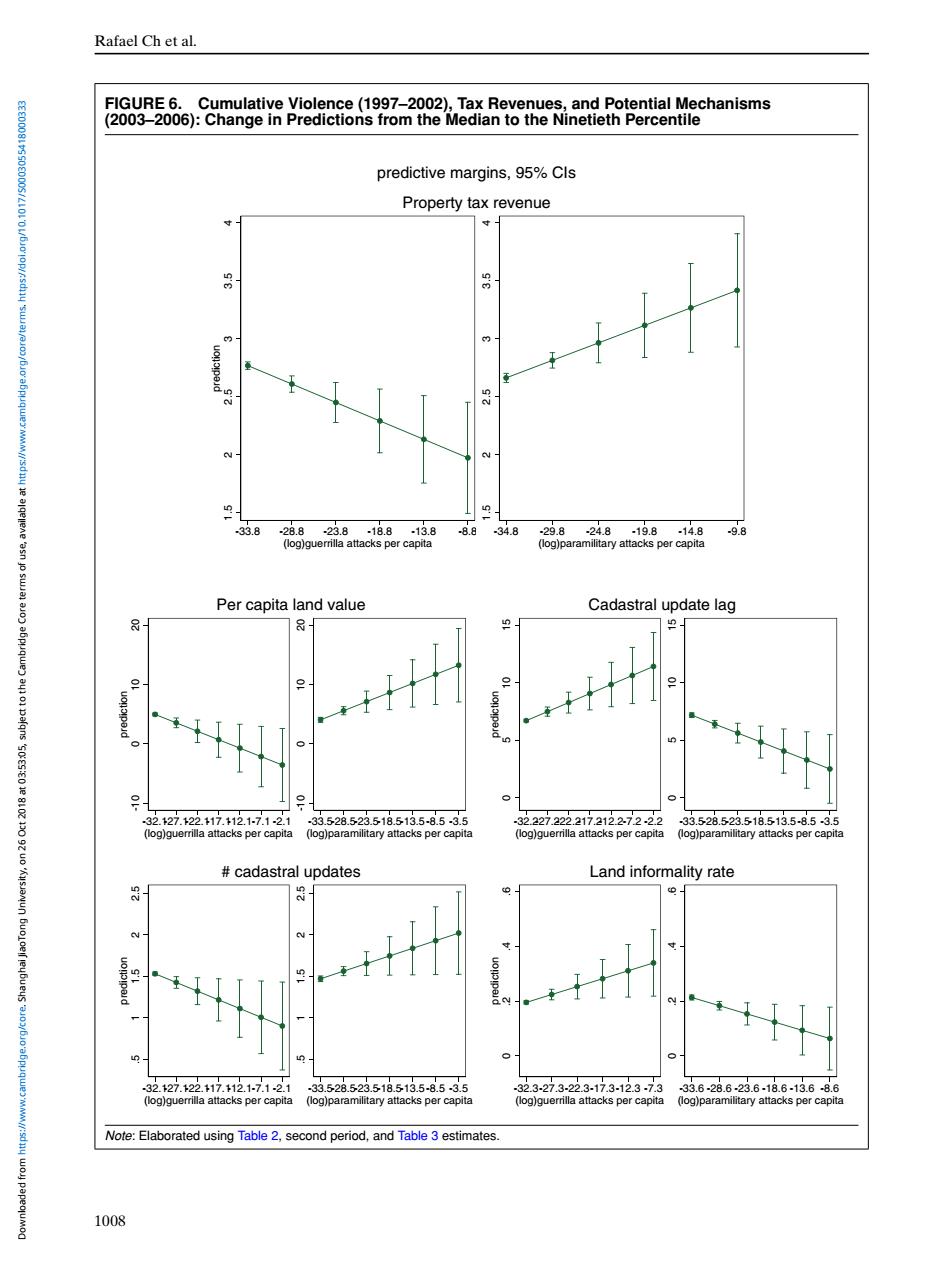
Rafael Ch et al. FIGURE 6.Cumulative Violence(1997-2002),Tax Revenues,and Potential Mechanisms (2003-2006):Change in Predictions from the Median to the Ninetieth Percentile predictive margins,95%Cls Property tax revenue 33.8 28.823.8-18.813.8 -8.8 34.8 29.8-24.8-19.8-14.8 9.8 (log)guerrilla attacks per capita (log)paramilitary attacks per capita Per capita land value Cadastral update lag 吧 32.127.122.117.112.1-7.1-2.1 33.528.523.518.513.5-8.5.3.5 .32227.222.217.212.2.72.22 33.528.523.518.513.5-8.53.5 (log)guerrilla attacks per capita (log)paramilitary attacks per capita (log)guerrilla attacks per capita (log)paramilitary attacks per capita cadastral updates Land informality rate 32.127.12217.112.1-7.1-2.1 .33.528.523.518.513.5-8.53.5 32.3-27.3-22.3.17.3-12.3.7.3 33.628.623.6-18.6-13.6-8.6 (log)guerrilla attacks per capita (log)paramilitary attacks per capita (log)guerrilla attacks per capita (log)paramilitary attacks per capita Note:Elaborated using Table 2,second period,and Table 3 estimates. 1008Rafael Ch et al. FIGURE 6. Cumulative Violence (1997–2002), Tax Revenues, and Potential Mechanisms (2003–2006): Change in Predictions from the Median to the Ninetieth Percentile 1.5 2 2.5 3 3.5 4 prediction -33.8 -28.8 -23.8 -18.8 -13.8 -8.8 (log)guerrilla attacks per capita 1.5 2 2.5 3 3.5 4 -34.8 -29.8 -24.8 -19.8 -14.8 -9.8 (log)paramilitary attacks per capita Property tax revenue predictive margins, 95% CIs -10 0 10 20 prediction -32.1-27.1-22.1-17.1-12.1-7.1 -2.1 (log)guerrilla attacks per capita -10 0 10 20 -33.5-28.5-23.5-18.5-13.5-8.5 -3.5 (log)paramilitary attacks per capita Per capita land value 0 5 10 15 prediction -32.2-27.2-22.2-17.2-12.2-7.2 -2.2 (log)guerrilla attacks per capita 0 5 10 15 -33.5-28.5-23.5-18.5-13.5-8.5 -3.5 (log)paramilitary attacks per capita Cadastral update lag .5 1 1.5 2 2.5 prediction -32.1-27.1-22.1-17.1-12.1-7.1 -2.1 (log)guerrilla attacks per capita .5 1 1.5 2 2.5 -33.5-28.5-23.5-18.5-13.5-8.5 -3.5 (log)paramilitary attacks per capita # cadastral updates 0 .2 .4 .6 prediction -32.3-27.3-22.3-17.3-12.3 -7.3 (log)guerrilla attacks per capita 0 .2 .4 .6 -33.6 -28.6 -23.6 -18.6 -13.6 -8.6 (log)paramilitary attacks per capita Land informality rate Note: Elaborated using Table 2, second period, and Table 3 estimates. 1008 Downloaded from https://www.cambridge.org/core. Shanghai JiaoTong University, on 26 Oct 2018 at 03:53:05, subject to the Cambridge Core terms of use, available at https://www.cambridge.org/core/terms. https://doi.org/10.1017/S0003055418000333