正在加载图片...
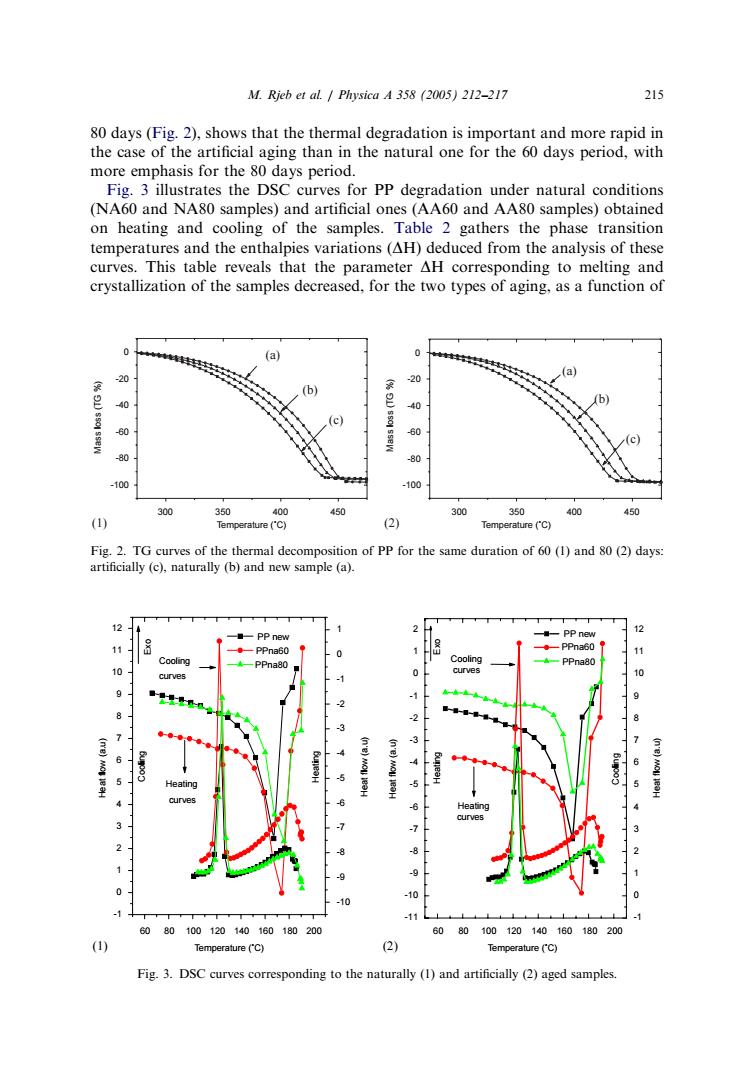
M.Rjeb et al.Physica A358(2005)212-217 215 80 days (Fig.2).shows that the thermal degradation is important and more rapid in the case of the artificial aging than in the natural one for the 60 days period,with more emphasis for the 80 days period. Fig.3illustrates the DSC s for PP degradation under natural conditions (NA60 and NA80 sa mples)and artificial。 (AA60 and AA80 on heating and cooling of the samples Table 2 temperatur and the enthalpies variations (AH deduced from he analysis of thes curves. This table reveals that the parameter AH orresponding to melting and crystallization of the samples decreased,for the two types of aging,as a function of 20 20 b (b) 00 300 350 450 000 35d 400 Fie.2 TGu of the thermal dee n of PP for the e duration of 60(1)and 80 (2)days artificially (c).naturally(b)and new sample (a). 80100120140160180200 10012010160180 20 Temperature (C) Fig.3.DSC curves corresponding to the naturally (1)and artificially (2)aged samples. 80 days (Fig. 2), shows that the thermaldegradation is important and more rapid in the case of the artificialaging than in the naturalone for the 60 days period, with more emphasis for the 80 days period. Fig. 3 illustrates the DSC curves for PP degradation under natural conditions (NA60 and NA80 samples) and artificial ones (AA60 and AA80 samples) obtained on heating and cooling of the samples. Table 2 gathers the phase transition temperatures and the enthalpies variations (DH) deduced from the analysis of these curves. This table reveals that the parameter DH corresponding to melting and crystallization of the samples decreased, for the two types of aging, as a function of ARTICLE IN PRESS -100 -80 -60 -40 -20 0 Mass loss (TG %) -100 -80 -60 -40 -20 0 Mass loss (TG %) 300 350 400 450 (a) (b) (c) (a) (b) (c) Temperature (˚C) 300 350 400 450 (1) (2) Temperature (˚C) Fig. 2. TG curves of the thermaldecomposition of PP for the same duration of 60 (1) and 80 (2) days: artificially (c), naturally (b) and new sample (a). -10 -9 -8 -7 -6 -5 -4 -3 -2 -1 0 1 60 80 100 120 140 160 180 200 -1 0 1 2 3 4 5 6 7 8 9 10 11 12 Exo Cooling Heating Heating Heating Heating curves curves curves Cooling Cooling curves PP new PP new PPna60 PPna60 PPna80 PPna80 Heat flow (a.u) Heat flow (a.u) Heat flow (a.u) Heat flow (a.u) Temperature (˚C) Temperature (˚C) 60 80 100 120 140 160 180 200 -11 -10 -9 -8 -7 -6 -5 -4 -3 -2 -1 0 1 2 -1 0 1 2 3 4 5 6 7 8 9 10 11 12 Cooling Exo (1) (2) Fig. 3. DSC curves corresponding to the naturally (1) and artificially (2) aged samples. M. Rjeb et al. / Physica A 358 (2005) 212–217 215