正在加载图片...
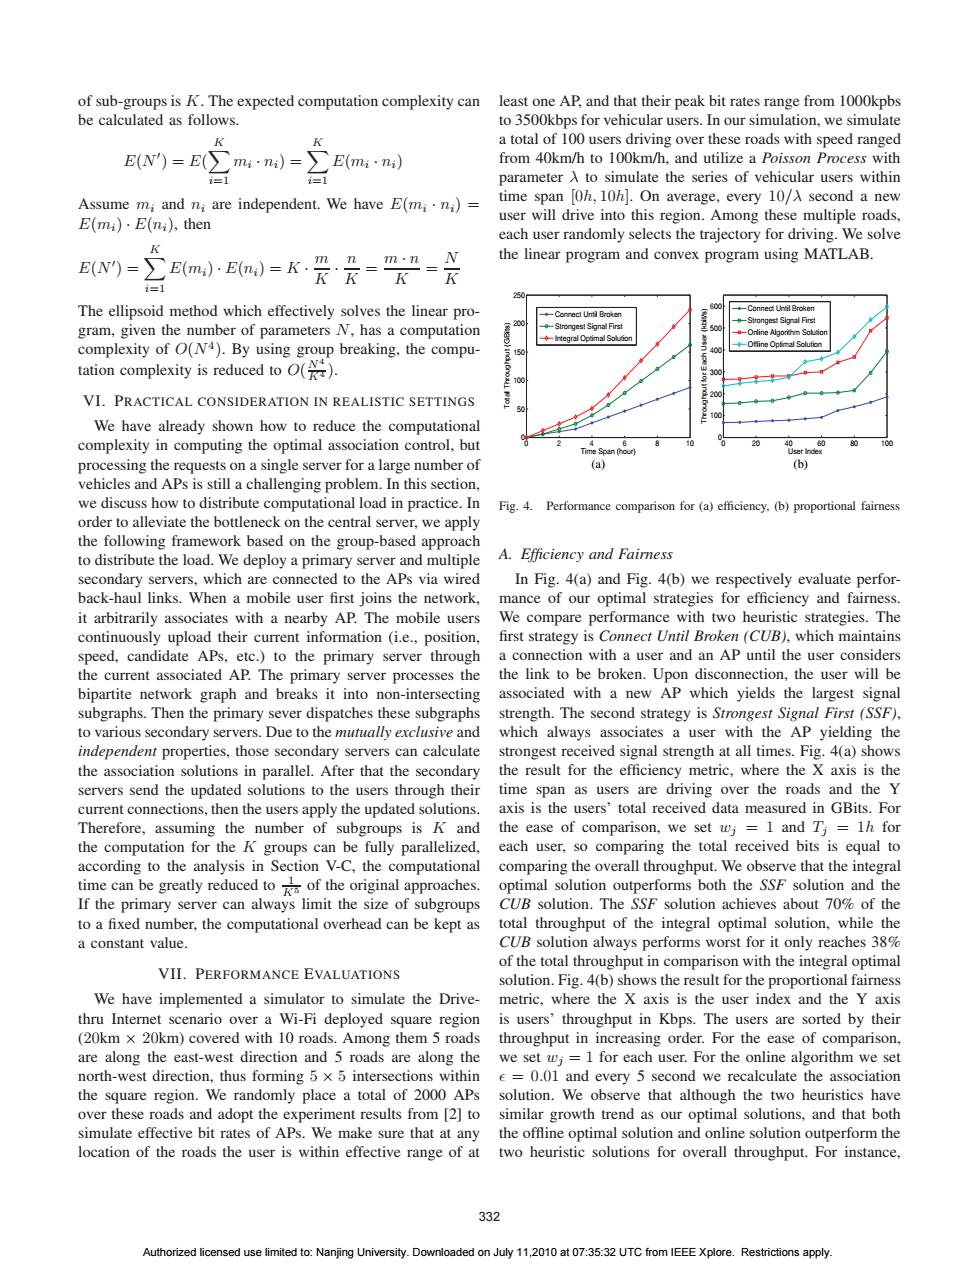
of sub-groups is K.The expected computation complexity can least one AP,and that their peak bit rates range from 1000kpbs be calculated as follows. to 3500kbps for vehicular users.In our simulation,we simulate K K a total of 100 users driving over these roads with speed ranged E(N')=E()T mi·ni) E(mi·ni from 40km/h to 100km/h.and utilize a Poisson Process with =1 i=1 parameter A to simulate the series of vehicular users within Assume m;and n;are independent. We have E(mi·n:)= time span [0h,10h].On average,every 10/A second a new E(m)·E(ni),then user will drive into this region.Among these multiple roads, each user randomly selects the trajectory for driving.We solve K m n m·n the linear program and convex program using MATLAB. E(N)= E(m)·E(n)=K K i=1 The ellipsoid method which effectively solves the linear pro- gram,given the number of parameters N,has a computation Strongest Signal First -Integral Optimal Soltion complexity of O(N4).By using group breaking,the compu- ◆Ofline Opfir-Solutio tation complexity is reduced to O(). VI.PRACTICAL CONSIDERATION IN REALISTIC SETTINGS We have already shown how to reduce the computational complexity in computing the optimal association control,but processing the requests on a single server for a large number of (a) (b) vehicles and APs is still a challenging problem.In this section, we discuss how to distribute computational load in practice.In Fig.4.Performance comparison for (a)efficiency,(b)proportional fairness order to alleviate the bottleneck on the central server,we apply the following framework based on the group-based approach to distribute the load.We deploy a primary server and multiple A.Efficiency and Fairness secondary servers,which are connected to the APs via wired In Fig.4(a)and Fig.4(b)we respectively evaluate perfor- back-haul links.When a mobile user first joins the network, mance of our optimal strategies for efficiency and fairness it arbitrarily associates with a nearby AP.The mobile users We compare performance with two heuristic strategies.The continuously upload their current information (i.e.,position, first strategy is Connect Until Broken(CUB),which maintains speed,candidate APs,etc.)to the primary server through a connection with a user and an aP until the user considers the current associated AP.The primary server processes the the link to be broken.Upon disconnection,the user will be bipartite network graph and breaks it into non-intersecting associated with a new AP which yields the largest signal subgraphs.Then the primary sever dispatches these subgraphs strength.The second strategy is Strongest Signal First(SSF), to various secondary servers.Due to the mutually exclusive and which always associates a user with the AP yielding the independent properties,those secondary servers can calculate strongest received signal strength at all times.Fig.4(a)shows the association solutions in parallel.After that the secondary the result for the efficiency metric,where the X axis is the servers send the updated solutions to the users through their time span as users are driving over the roads and the Y current connections,then the users apply the updated solutions. axis is the users'total received data measured in GBits.For Therefore,assuming the number of subgroups is k and the ease of comparison,we set wj=1 and Ti=1h for the computation for the K groups can be fully parallelized, each user,so comparing the total received bits is equal to according to the analysis in Section V-C,the computational comparing the overall throughput.We observe that the integral time can be greatly reduced tos of the original approaches. optimal solution outperforms both the SSF solution and the If the primary server can always limit the size of subgroups CUB solution.The SSF solution achieves about 70%of the to a fixed number,the computational overhead can be kept as total throughput of the integral optimal solution,while the a constant value. CUB solution always performs worst for it only reaches 38% of the total throughput in comparison with the integral optimal VII.PERFORMANCE EVALUATIONS solution.Fig.4(b)shows the result for the proportional fairness We have implemented a simulator to simulate the Drive- metric,where the X axis is the user index and the Y axis thru Internet scenario over a Wi-Fi deployed square region is users'throughput in Kbps.The users are sorted by their (20km x 20km)covered with 10 roads.Among them 5 roads throughput in increasing order.For the ease of comparison, are along the east-west direction and 5 roads are along the we set wj=1 for each user.For the online algorithm we set north-west direction,thus forming 5 x 5 intersections within e=0.01 and every 5 second we recalculate the association the square region.We randomly place a total of 2000 APs solution.We observe that although the two heuristics have over these roads and adopt the experiment results from [2]to similar growth trend as our optimal solutions,and that both simulate effective bit rates of APs.We make sure that at any the offline optimal solution and online solution outperform the location of the roads the user is within effective range of at two heuristic solutions for overall throughput.For instance, 332 Authorized licensed use limited to:Nanjing University.Downloaded on July 11,2010 at 07:35:32 UTC from IEEE Xplore.Restrictions apply.of sub-groups is K. The expected computation complexity can be calculated as follows. E(N ) = E( K i=1 mi · ni) = K i=1 E(mi · ni) Assume mi and ni are independent. We have E(mi · ni) = E(mi) · E(ni), then E(N ) = K i=1 E(mi) · E(ni) = K · m K · n K = m · n K = N K The ellipsoid method which effectively solves the linear program, given the number of parameters N, has a computation complexity of O(N4). By using group breaking, the computation complexity is reduced to O( N4 K4 ). VI. PRACTICAL CONSIDERATION IN REALISTIC SETTINGS We have already shown how to reduce the computational complexity in computing the optimal association control, but processing the requests on a single server for a large number of vehicles and APs is still a challenging problem. In this section, we discuss how to distribute computational load in practice. In order to alleviate the bottleneck on the central server, we apply the following framework based on the group-based approach to distribute the load. We deploy a primary server and multiple secondary servers, which are connected to the APs via wired back-haul links. When a mobile user first joins the network, it arbitrarily associates with a nearby AP. The mobile users continuously upload their current information (i.e., position, speed, candidate APs, etc.) to the primary server through the current associated AP. The primary server processes the bipartite network graph and breaks it into non-intersecting subgraphs. Then the primary sever dispatches these subgraphs to various secondary servers. Due to the mutually exclusive and independent properties, those secondary servers can calculate the association solutions in parallel. After that the secondary servers send the updated solutions to the users through their current connections, then the users apply the updated solutions. Therefore, assuming the number of subgroups is K and the computation for the K groups can be fully parallelized, according to the analysis in Section V-C, the computational time can be greatly reduced to 1 K5 of the original approaches. If the primary server can always limit the size of subgroups to a fixed number, the computational overhead can be kept as a constant value. VII. PERFORMANCE EVALUATIONS We have implemented a simulator to simulate the Drivethru Internet scenario over a Wi-Fi deployed square region (20km × 20km) covered with 10 roads. Among them 5 roads are along the east-west direction and 5 roads are along the north-west direction, thus forming 5 × 5 intersections within the square region. We randomly place a total of 2000 APs over these roads and adopt the experiment results from [2] to simulate effective bit rates of APs. We make sure that at any location of the roads the user is within effective range of at least one AP, and that their peak bit rates range from 1000kpbs to 3500kbps for vehicular users. In our simulation, we simulate a total of 100 users driving over these roads with speed ranged from 40km/h to 100km/h, and utilize a Poisson Process with parameter λ to simulate the series of vehicular users within time span [0h, 10h]. On average, every 10/λ second a new user will drive into this region. Among these multiple roads, each user randomly selects the trajectory for driving. We solve the linear program and convex program using MATLAB. 0 2 4 6 8 10 0 50 100 150 200 250 Time Span (hour) Total Throughput (GBits) Connect Until Broken Strongest Signal First Integral Optimal Solution 0 20 40 60 80 100 0 100 200 300 400 500 600 User Index Throughput for Each User (kbit/s) Connect Until Broken Strongest Signal First Online Algorithm Solution Offline Optimal Solution (a) (b) Fig. 4. Performance comparison for (a) efficiency, (b) proportional fairness A. Efficiency and Fairness In Fig. 4(a) and Fig. 4(b) we respectively evaluate performance of our optimal strategies for efficiency and fairness. We compare performance with two heuristic strategies. The first strategy is Connect Until Broken (CUB), which maintains a connection with a user and an AP until the user considers the link to be broken. Upon disconnection, the user will be associated with a new AP which yields the largest signal strength. The second strategy is Strongest Signal First (SSF), which always associates a user with the AP yielding the strongest received signal strength at all times. Fig. 4(a) shows the result for the efficiency metric, where the X axis is the time span as users are driving over the roads and the Y axis is the users’ total received data measured in GBits. For the ease of comparison, we set wj = 1 and Tj = 1h for each user, so comparing the total received bits is equal to comparing the overall throughput. We observe that the integral optimal solution outperforms both the SSF solution and the CUB solution. The SSF solution achieves about 70% of the total throughput of the integral optimal solution, while the CUB solution always performs worst for it only reaches 38% of the total throughput in comparison with the integral optimal solution. Fig. 4(b) shows the result for the proportional fairness metric, where the X axis is the user index and the Y axis is users’ throughput in Kbps. The users are sorted by their throughput in increasing order. For the ease of comparison, we set wj = 1 for each user. For the online algorithm we set = 0.01 and every 5 second we recalculate the association solution. We observe that although the two heuristics have similar growth trend as our optimal solutions, and that both the offline optimal solution and online solution outperform the two heuristic solutions for overall throughput. For instance, 332 Authorized licensed use limited to: Nanjing University. Downloaded on July 11,2010 at 07:35:32 UTC from IEEE Xplore. Restrictions apply. ���