正在加载图片...
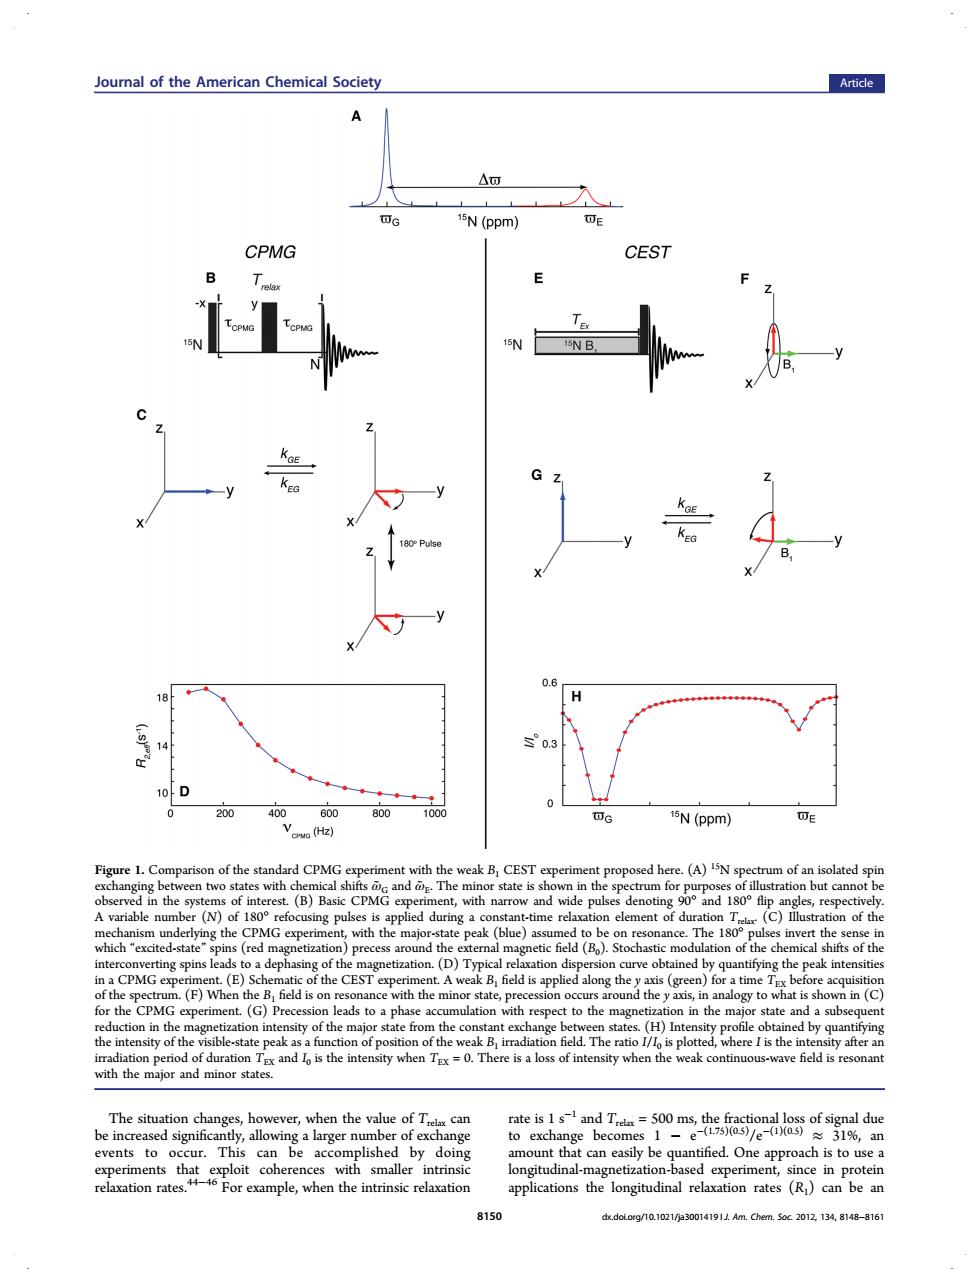
Journal of the American Chemical Society Article A "N(ppm) CPMG CEST 80 N(ppm) Figure 1.Ce of the rd CPM eak B CEST es,respe of th CEST the d is app for time(C) to the of th ates (H)Inte and is the intensity when.There is a loss of inte re field is reson omle when the intrinsic relration 8150 The situation changes, however, when the value of Trelax can be increased significantly, allowing a larger number of exchange events to occur. This can be accomplished by doing experiments that exploit coherences with smaller intrinsic relaxation rates.44−46 For example, when the intrinsic relaxation rate is 1 s−1 and Trelax = 500 ms, the fractional loss of signal due to exchange becomes 1 − e−(1.75)(0.5)/e−(1)(0.5) ≈ 31%, an amount that can easily be quantified. One approach is to use a longitudinal-magnetization-based experiment, since in protein applications the longitudinal relaxation rates (R1) can be an Figure 1. Comparison of the standard CPMG experiment with the weak B1 CEST experiment proposed here. (A) 15N spectrum of an isolated spin exchanging between two states with chemical shifts ω̃ G and ω̃ E. The minor state is shown in the spectrum for purposes of illustration but cannot be observed in the systems of interest. (B) Basic CPMG experiment, with narrow and wide pulses denoting 90° and 180° flip angles, respectively. A variable number (N) of 180° refocusing pulses is applied during a constant-time relaxation element of duration Trelax. (C) Illustration of the mechanism underlying the CPMG experiment, with the major-state peak (blue) assumed to be on resonance. The 180° pulses invert the sense in which “excited-state” spins (red magnetization) precess around the external magnetic field (B0). Stochastic modulation of the chemical shifts of the interconverting spins leads to a dephasing of the magnetization. (D) Typical relaxation dispersion curve obtained by quantifying the peak intensities in a CPMG experiment. (E) Schematic of the CEST experiment. A weak B1 field is applied along the y axis (green) for a time TEX before acquisition of the spectrum. (F) When the B1 field is on resonance with the minor state, precession occurs around the y axis, in analogy to what is shown in (C) for the CPMG experiment. (G) Precession leads to a phase accumulation with respect to the magnetization in the major state and a subsequent reduction in the magnetization intensity of the major state from the constant exchange between states. (H) Intensity profile obtained by quantifying the intensity of the visible-state peak as a function of position of the weak B1 irradiation field. The ratio I/I0 is plotted, where I is the intensity after an irradiation period of duration TEX and I0 is the intensity when TEX = 0. There is a loss of intensity when the weak continuous-wave field is resonant with the major and minor states. Journal of the American Chemical Society Article 8150 dx.doi.org/10.1021/ja3001419 | J. Am. Chem. Soc. 2012, 134, 8148−8161