正在加载图片...

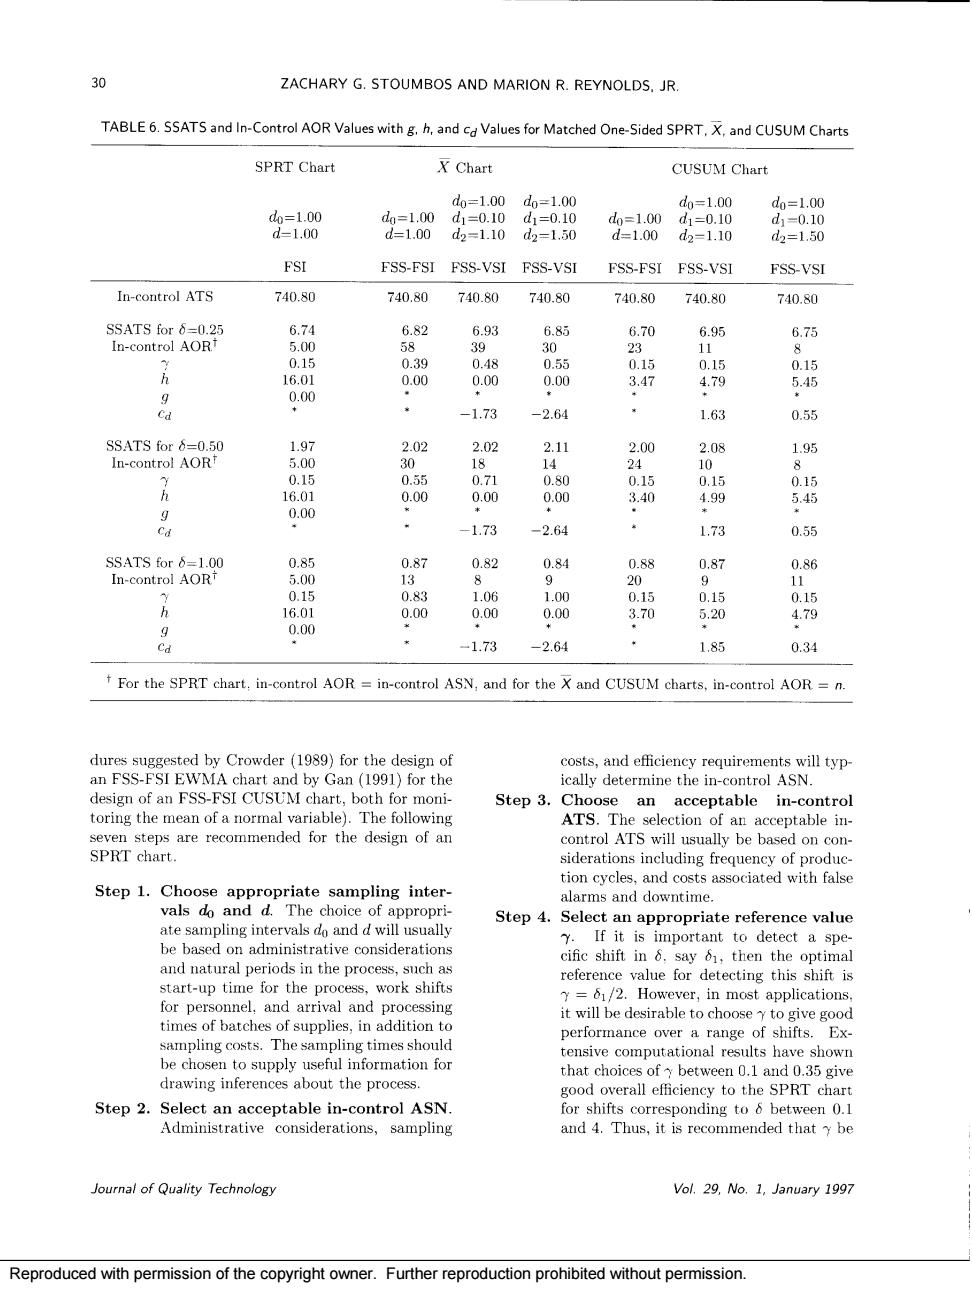
ZACHARY G.STOUMBOS AND MARION R.REYNOLDS.JR TABLE6.SSATS and In-Control AOR Values with g.and Values for Matched One-Sided SPRT,and CUSUM Charts SPRT Chart X Chart CUSUM Chatt =1.00 do=1.00 d2-1.10 -150 FSI FSS-FSI FSS-VSI FSS-VSI FSS-FSI FSS-VSI FSS-VSI In-control ATS 740.80 740.80 740.0 740.0 740.80 740.80 740.80 6.93 6.95 6.75 5 0.00 -1.73 -2.64 1.63 0.55 SSATS or 1,97 30e 2.11 2.08 15 0.00 0.00 88 0 9 -1.73 -2.64 1.73 0.5 08 087 g84 0.87 0.86 0.00 -1.73 -2.64 1.85 0.34 For the SPRT chart,in-control AOR=in-control ASN,and for the X and CUSUM charts,in-control AOR=n dures sted by Crowder (1989)for the design of costs.and efficiency equirements will typ SI EWMA cally determine the in-control ASN. an acceptable in-control steps are recommended for the design of an trol ATS will ally he hased on SPRT chart. siderations including frequency of produe Step 1.Choose appropriate sampling inter tion cycle nd costs associated with false vals do and ppropr Step 4.Selec t an iate reference value be based on administrative considerations If it is important to detect a spe ific shift in then t ma and natural periods in the proces,such ork shift 2.Ho al and gtimes shoul nce ov sampling costs. The sa for that choice ybetween 0.1 and 0.35 giv Step 2.Selec able dlectanaeptablenioetroaAi ASN and 4.Thus,itis manded that h Journal of Quality Technology Vol.29.No.1,January 1997 Reproduced with permission of the copyright owner.Further reproduction prohibited without permission. Reproduced with permission of the copyright owner. Further reproduction prohibited without permission