正在加载图片...
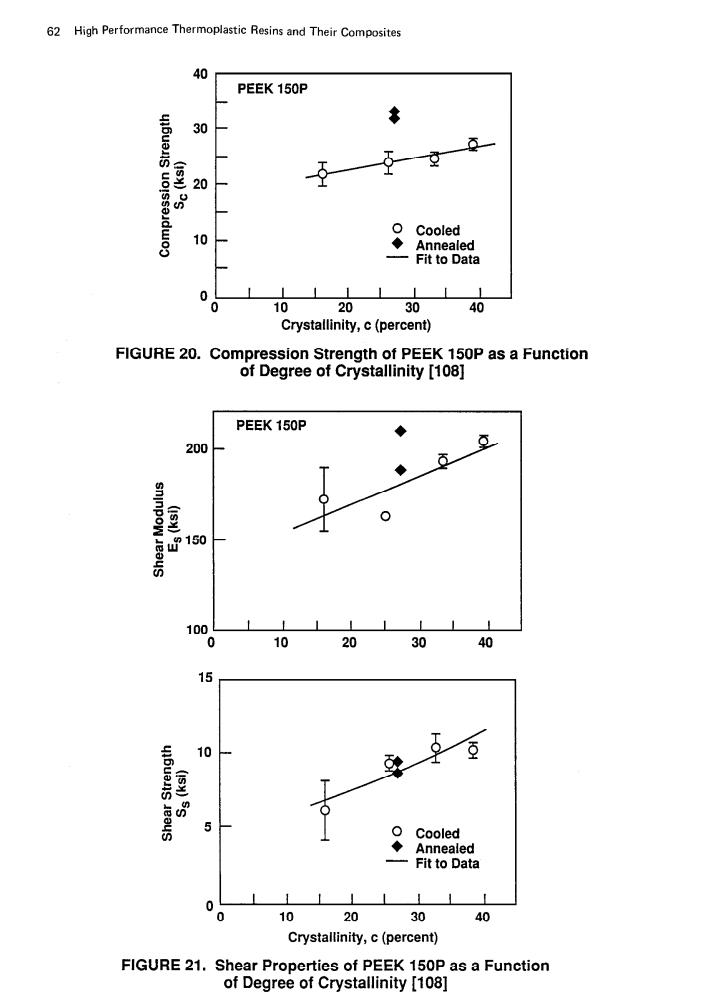
62 High Performance Thermoplastic Resins and Their Composites 40 PEEK 150P 30 20 0 Cooled 10 Annealed Fit to Data 0 10 20 30 40 Crystallinity,c(percent) FIGURE 20.Compression Strength of PEEK 150P as a Function of Degree of Crystallinity [108] PEEK 150P 200 sninpow Jeays 150 100 0 10 20 30 40 15 10 5 Cooled Annealed Fit to Data 0 10 20 30 40 Crystallinity,c(percent) FIGURE 21.Shear Properties of PEEK 150P as a Function of Degree of Crystallinity [108]62 High Performame Thermoplastic Resins and Their Composites t PEEK 15OP : 0 Cooled + Annealed - Fit to Data 01 0 10 20 30 40 Crystallinity, c (percent) FIGURE 20. Compression Strength of PEEK 150P as a Function of Degree of Crystallinity [lOS] 200 PEEK 150P 1 * 0 10 20 30 40 Crystallinity, c (percent) FIGURE 21. Shear Properties of PEEK 150P as a Function of Degree of Crystallinity [108]