正在加载图片...
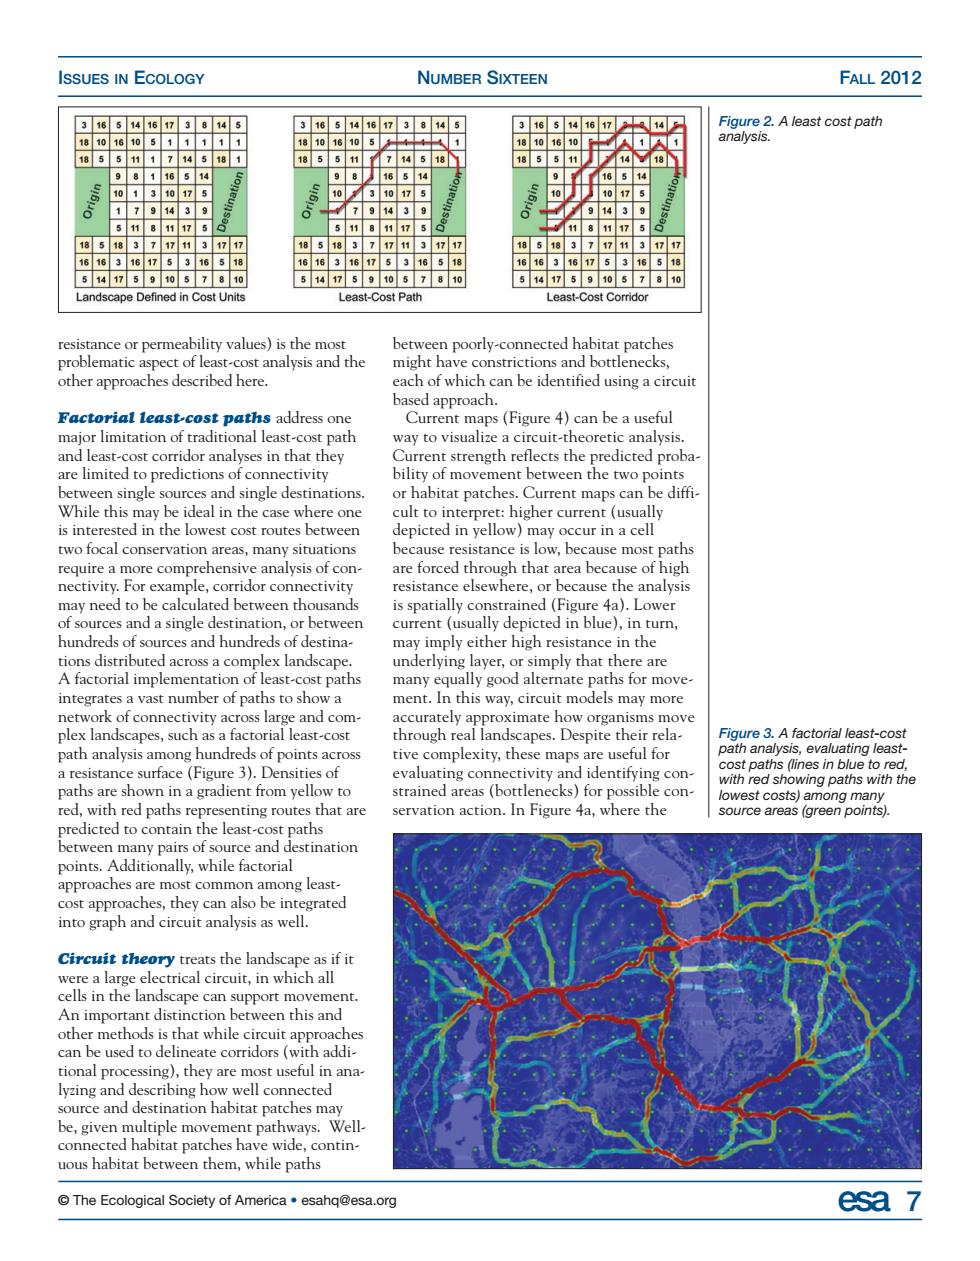
ISSUES IN ECOLOGY NUMBER SIXTEEN FALL 2012 W2Aeascostpah 50 15 5 717 andscape Defined in Cost Unit Least-Cost Pat Least-Cost Corridor resistance or permeability values)is the mo poorly-connected habitat patches problematic a of least-cost analysis and the might ha constrictions and bottlenecks, factorial least cost paths address one Current maps (Figure 4)can be a useful major limitation of traditional least-cost path way to visualize a circuit-theoretic analysis lyses in that they en single sources and single destinations or habitat patches.Current maps can be diffi in west cost route ctonepibieherure nay occur in a ce require a more comprehensive analysis of con are forced through that area because of high nectivity.For example,co elsewhere. may need to s spa all d n blue) hundreds of sources and hundreds of destina may imply either high resistance in the underlying layer,or simply that many e there are y go inte ae move network of connectivity ac ss large and com- oximate how organisms m scapes,suck torial least-cos analysis among paths are shown in a gradient from yellow to ng paths with the servation action.In Figure 4a,where the rce areas (green points on among least Circuit the the lands cells in the landscape can support movement en this and other m nat whi tional processing),they are most useful in ana be.gi connecred habitat parches have wide.contin uous habitat between them,while paths The Ecological Society of America.esahg@esa.oro esa 7© The Ecological Society of America • esahq@esa.org esa 7 ISSUES IN ECOLOGY NUMBER SIXTEEN FALL 2012 resistance or permeability values) is the most problematic aspect of least-cost analysis and the other approaches described here. Factorial least-cost paths address one major limitation of traditional least-cost path and least-cost corridor analyses in that they are limited to predictions of connectivity between single sources and single destinations. While this may be ideal in the case where one is interested in the lowest cost routes between two focal conservation areas, many situations require a more comprehensive analysis of connectivity. For example, corridor connectivity may need to be calculated between thousands of sources and a single destination, or between hundreds of sources and hundreds of destinations distributed across a complex landscape. A factorial implementation of least-cost paths integrates a vast number of paths to show a network of connectivity across large and complex landscapes, such as a factorial least-cost path analysis among hundreds of points across a resistance surface (Figure 3). Densities of paths are shown in a gradient from yellow to red, with red paths representing routes that are predicted to contain the least-cost paths between many pairs of source and destination points. Additionally, while factorial approaches are most common among leastcost approaches, they can also be integrated into graph and circuit analysis as well. Circuit theory treats the landscape as if it were a large electrical circuit, in which all cells in the landscape can support movement. An important distinction between this and other methods is that while circuit approaches can be used to delineate corridors (with additional processing), they are most useful in analyzing and describing how well connected source and destination habitat patches may be, given multiple movement pathways. Wellconnected habitat patches have wide, continuous habitat between them, while paths between poorly-connected habitat patches might have constrictions and bottlenecks, each of which can be identified using a circuit based approach. Current maps (Figure 4) can be a useful way to visualize a circuit-theoretic analysis. Current strength reflects the predicted probability of movement between the two points or habitat patches. Current maps can be difficult to interpret: higher current (usually depicted in yellow) may occur in a cell because resistance is low, because most paths are forced through that area because of high resistance elsewhere, or because the analysis is spatially constrained (Figure 4a). Lower current (usually depicted in blue), in turn, may imply either high resistance in the underlying layer, or simply that there are many equally good alternate paths for movement. In this way, circuit models may more accurately approximate how organisms move through real landscapes. Despite their relative complexity, these maps are useful for evaluating connectivity and identifying constrained areas (bottlenecks) for possible conservation action. In Figure 4a, where the Figure 2. A least cost path analysis. Figure 3. A factorial least-cost path analysis, evaluating leastcost paths (lines in blue to red, with red showing paths with the lowest costs) among many source areas (green points)