正在加载图片...
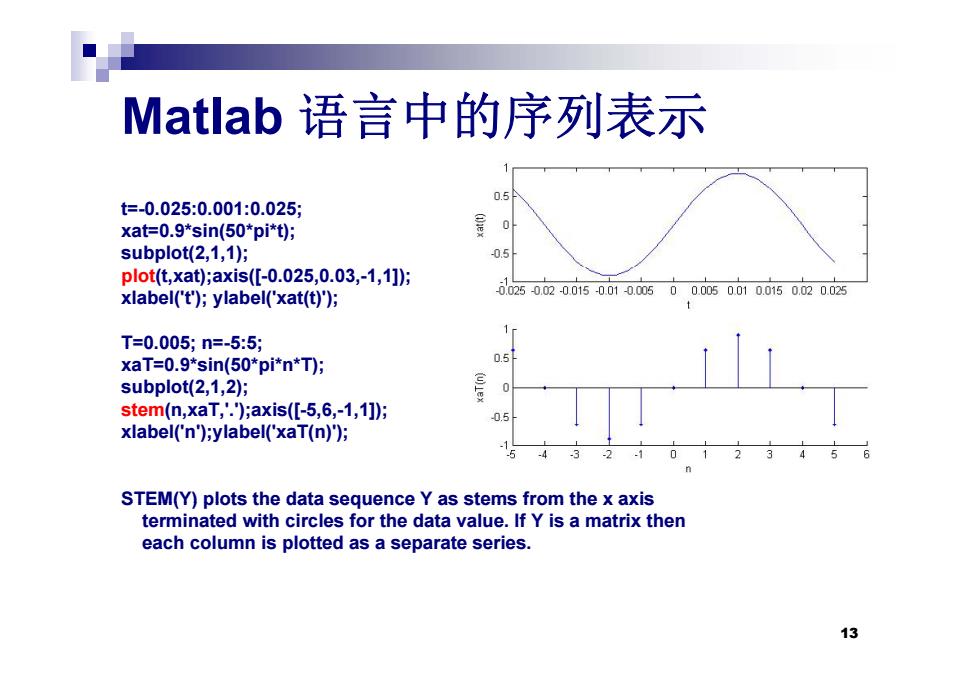
Matlab语言中的序列表示 t=-0.025:0.001:0.025: xat=0.9*sin(50*pi*t); (ex subplot(2,1,1); 0.5 plot(t,xat);axis(-0.025,0.03,-1,1])i xlabel('t');ylabel('xat(t)'); 002500200150.010.00500.0050.010.0150.020.02 T=0.005;n=-5:5; xaT=0.9*sin(50*pi*n*T); 0.5 subplot(2,1,2); (u)Lex stem(n,xaT,'.");axis([-5,6,-1,1]); xlabel('n');ylabel('xaT(n)); STEM(Y)plots the data sequence Y as stems from the x axis terminated with circles for the data value.If Y is a matrix then each column is plotted as a separate series. 13Matlab 语言中的序列表示 t=-0.025:0.001:0.025; xat=0.9*sin(50*pi*t); subplot(2,1,1); plot(t,xat);axis([-0.025,0.03,-1,1]); xlabel('t'); ylabel('xat(t)'); T 0= 005; n .005; n=-5:5; xaT=0.9*sin(50*pi*n*T); subplot(2,1,2); stem(n,xaT,'.');axis([-5,6,-1,1]); xlabel( ) ( ( )) ('n');ylabel('xaT(n)'); STEM(Y) plots the data sequence Y as stems from the x axis STEM(Y) plots the data sequence Y as stems from the x axis terminated with circles for the data value. If Y is a matrix then each column is plotted as a separate series. 13