正在加载图片...
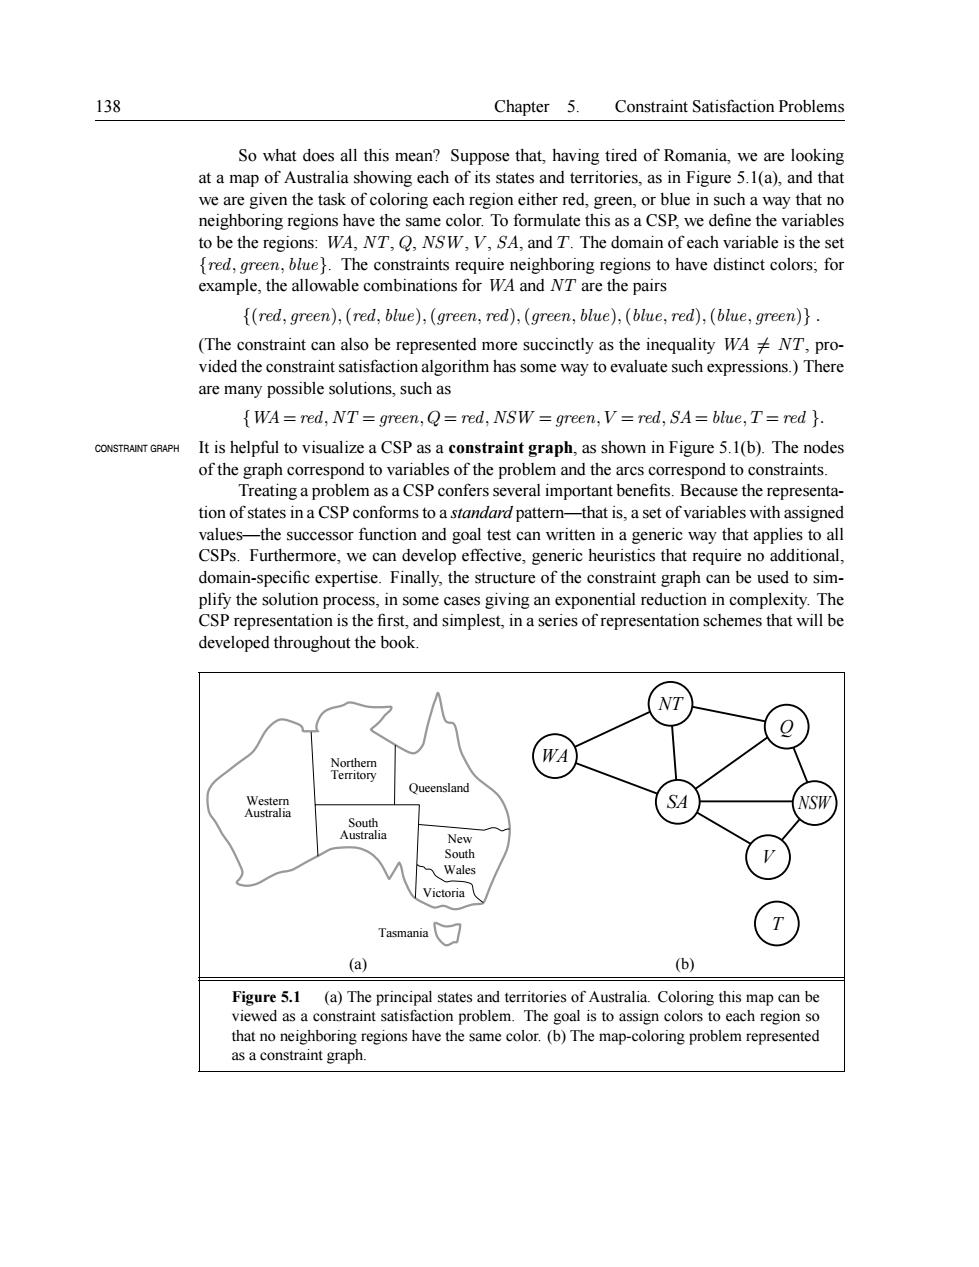
138 Chapter 5.Constraint Satisfaction Problems what does all this mean?Suppose that,having tired of Romnia.eare ookin at a map of. eachregion either red.green,or blue insandh of c owing cach and territories,as ing regions nis as a CSP,we to be the regions the se (red,green).(red,biue),(green,red),(green,blue).(bue,red),(blue,green) (The constraint can also be represented more succinctly as the inequality WA NT,pro- vided the constraint satisfaction algorithm has some way to evaluate such expressions.)There are many possible solutions such as {WA=red,NT=green,Q=red,NSW green,V=red,SA=blue,T=red } It is helpful to visualize a CSPas a constraint graph,as shown in Figure 5.1(b).The nodes of the graph correspond to variables of the problem and the arcs correspond to constraints Treating a problem as a CSP confers several important benefits.Because the representa tion of states in a CSP conforms to a standard pattern-that is,a set of variables with assigned -the successor function and goal test can written in a generic way that applies to al CSPs.Furthermore,we can develop effective,generic heuristics that require no additional domain-specific expertise.Finally,the structure of the constraint graph can be used to sim- plify the solution process,in some cases giving an exponential reduction in complexity.The CSP representation is the first,and simplest,in a series of representation schemes that will be developed throughout the book. NT SA Victoria Tasmania (a) (b) Figure 5.1 on pro s to map-c ng pr m represente as a constraint graph138 Chapter 5. Constraint Satisfaction Problems So what does all this mean? Suppose that, having tired of Romania, we are looking at a map of Australia showing each of its states and territories, as in Figure 5.1(a), and that we are given the task of coloring each region either red, green, or blue in such a way that no neighboring regions have the same color. To formulate this as a CSP, we define the variables to be the regions: WA, NT, Q, NSW , V , SA, and T. The domain of each variable is the set {red, green, blue}. The constraints require neighboring regions to have distinct colors; for example, the allowable combinations for WA and NT are the pairs {(red, green),(red, blue),(green, red),(green, blue),(blue, red),(blue, green)} . (The constraint can also be represented more succinctly as the inequality WA 6= NT, provided the constraint satisfaction algorithm has some way to evaluate such expressions.) There are many possible solutions, such as {WA = red, NT = green, Q = red, NSW = green, V = red, SA = blue, T = red }. CONSTRAINT GRAPH It is helpful to visualize a CSP as a constraint graph, as shown in Figure 5.1(b). The nodes of the graph correspond to variables of the problem and the arcs correspond to constraints. Treating a problem as a CSP confers several important benefits. Because the representation of states in a CSP conforms to a standard pattern—that is, a set of variables with assigned values—the successor function and goal test can written in a generic way that applies to all CSPs. Furthermore, we can develop effective, generic heuristics that require no additional, domain-specific expertise. Finally, the structure of the constraint graph can be used to simplify the solution process, in some cases giving an exponential reduction in complexity. The CSP representation is the first, and simplest, in a series of representation schemes that will be developed throughout the book. Western Australia Northern Territory South Australia Queensland New South Wales Victoria Tasmania WA NT SA Q NSW V T (a) (b) Figure 5.1 (a) The principal states and territories of Australia. Coloring this map can be viewed as a constraint satisfaction problem. The goal is to assign colors to each region so that no neighboring regions have the same color. (b) The map-coloring problem represented as a constraint graph