正在加载图片...

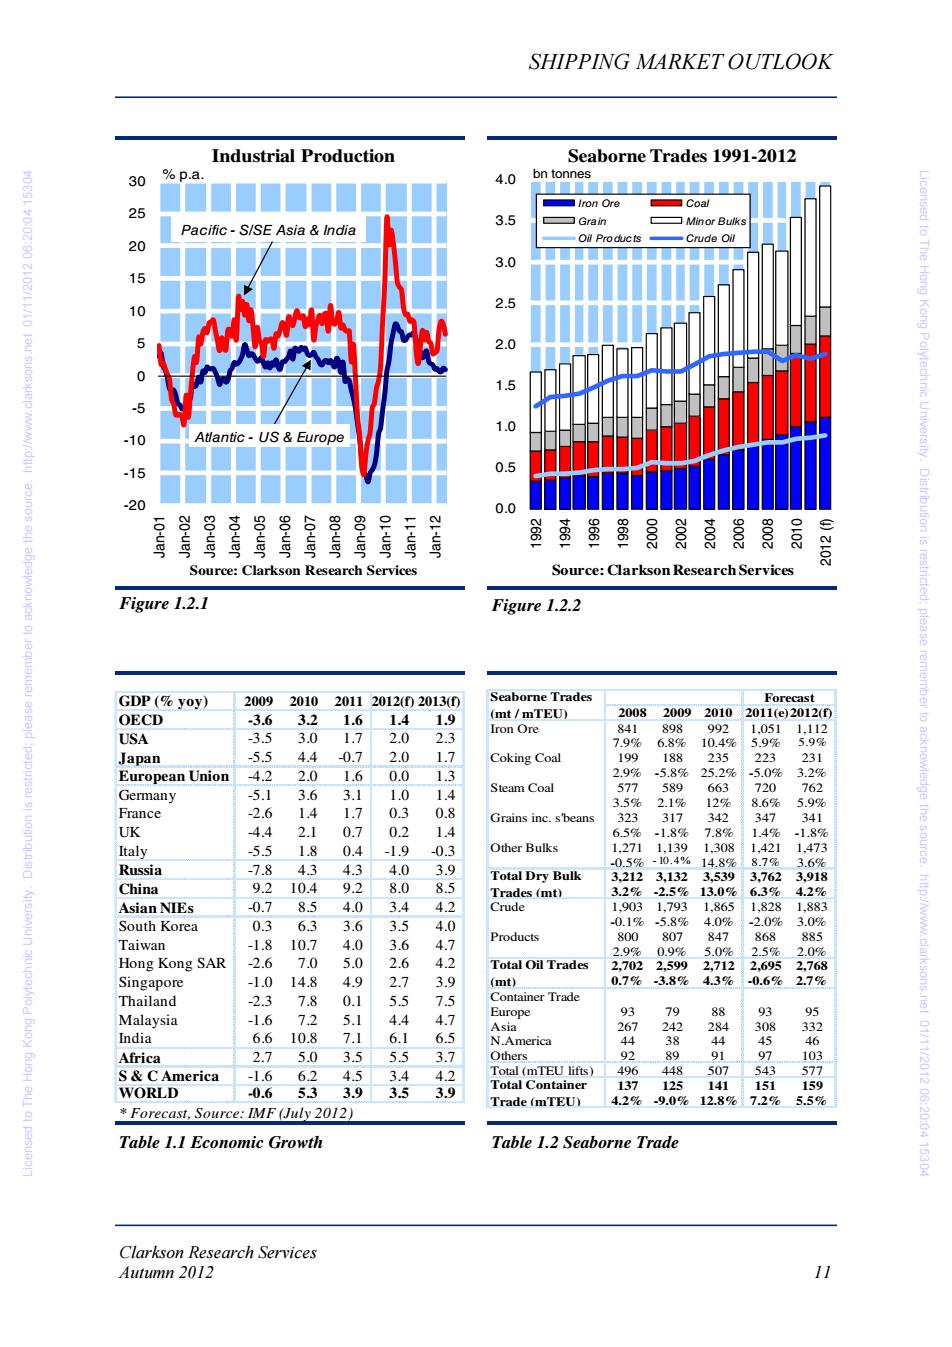
SHIPPING MARKET OUTLOOK Industrial Production Seaborne Trades 1991-2012 30 %p.a. 4.0 bn tonnes ■■■■■■■■■■■■■ ▣/ron Ore ▣Coal 25 3.5 0ESL F0:02:90 Z102/LL/10 lau Pacific-S/SE Asia India Grain Minor Bulks 20 Oil Products Crude Oil 3.0 15 10 2.5 2.0 1.5 -5 1.0 -10 Atlantic-US Europe -15 0.5 -20 0.0 8 感国家員賞高胃局 点 Source:Clarkson Research Services Source:Clarkson Research Services Figure 1.2.1 Figure 1.2.2 GDP(%yoy) 2009 201020112012(02013(0 Seaborne Trades Forecast OECD -3.6 3.2 1.6 1.41.9 (mt/mTEU) 2008 2009 2010 2011(e)2012(fD Iron Ore 841 898 992 1.051 1,112 icensed to The Hong Kong Polytechnic University.Distribution is restricted:please remember to acknowledge the source. USA -3.5 3.0 1.7 2.0 2.3 7.9% 687 10.4% 59% 5.99% Japan -5.5 4.4 -0.7 2.0 1.7 Coking Coal 199 188 235 223 231 European Union -4.2 2.0 1.6 0.01.3 2.9% -5.8% 25.2% 5.0% 3.2% 577 589 Germany -5.1 3.6 3.1 1.0 1.4 Steam Coal 663 720 762 3.5% 2.1% 12 8.6% 597 France -2.6 1.4 1.7 0.3 0.8 Grains inc.s'beans 323 317 342 347 341 UK 4.4 2.1 0.7 0.2 1.4 6.5% -1.8% 7.8% 1.4% -1.8% Italy -5.5 1.8 0.4 -1.9 -0.3 Other Bulks 1271 1139 1308 1,421 1,473 8.7% Russia -7.8 4.3 4.3 4.0 3.9 -0.5%-10.4% 14.8% 3.6% Total Dry Bulk 3.212 3.132 3.539 3.762 3.918 China 9.210.4 9.2 8.0 8.5 Trades (mt) 3.2% -2.5% 13.0% 6.3% 4.2% Asian NIEs -0.7 8.5 4.0 3.4 4.2 Crude 1.903 1,793 1,865 1,828 1,883 South Korea 0.3 6.3 3.6 3.5 4.0 -0.16 .58% 4.0% .2.0% 3.0% 800 807 868 885 Taiwan -1.8 10.7 4.0 3.6 4.7 Products 847 2.9% 0.9% 5.0% 2.5% 2.0% Hong Kong SAR -2.6 7.0 5.0 2.6 4.2 Total Oil Trades 2.702 2.599 2,712 2,695 2,768 Singapore -1.0 14.8 4.9 2.7 3.9 (mt) 0.7% 3.8% 4.3% -0.6% 2.79% Thailand -2.3 7.8 0.1 5.5 7.5 Container Trade 79 Malaysia -1.6 7.2 5.1 4.7 Europe 93 88 4.4 93 Asia 267 242 284 308 332 India 6.6 10.8 7.1 6.1 6.5 N.America 44 38 44 45 Africa 2.7 5.0 3.5 5.5 3.7 Others 92 8 91 97 103 S&CAmerica -1.6 6.2 4.5 3.4 4.2 Total (mTEU lifts) 496 448 507 543 577 53 3.9 3.5 3.9 Total Container 137 125 141 151 WORLD -0.6 159 Trade (mTEU) 4.2% -9.0%12.8% 7.2% 5.5% Forecast,Source:IMF (July 2012) http://www.clarksons.nel 01/11/2012 06:20:04 15304 Table 1.1 Economic Growth Table 1.2 Seaborne Trade Clarkson Research Services Autumn 2012 11Clarkson Research Services Autumn 2012 11 SHIPPING MARKET OUTLOOK Table 1.1 Economic Growth Table 1.2 Seaborne Trade Figure 1.2.1 Figure 1.2.2 -20 -15 -10 -505 10 15 20 25 30 Jan-01 Jan-02 Jan-03 Jan-04 Jan-05 Jan-06 Jan-07 Jan-08 Jan-09 Jan-10 Jan-11 Jan-12 % p.a. Source: Clarkson Research Services Industrial Production Pacific - S/SE Asia & India Atlantic - US & Europe 0.0 0.5 1.0 1.5 2.0 2.5 3.0 3.5 4.0 1992 1994 1996 1998 2000 2002 2004 2006 2008 2010 2012 (f) bn tonnes Source: Clarkson Research Services Seaborne Trades 1991-2012 Iron Ore Coal Grain Minor Bulks Oil Products Crude Oil GDP (% yoy) 2009 2010 2011 2012(f) 2013(f) OECD -3.6 3.2 1.6 1.4 1.9 USA -3.5 3.0 1.7 2.0 2.3 Japan -5.5 4.4 -0.7 2.0 1.7 European Union -4.2 2.0 1.6 0.0 1.3 Germany -5.1 3.6 3.1 1.0 1.4 France -2.6 1.4 1.7 0.3 0.8 UK -4.4 2.1 0.7 0.2 1.4 Italy -5.5 1.8 0.4 -1.9 -0.3 Russia -7.8 4.3 4.3 4.0 3.9 China 9.2 10.4 9.2 8.0 8.5 Asian NIEs -0.7 8.5 4.0 3.4 4.2 South Korea 0.3 6.3 3.6 3.5 4.0 Taiwan -1.8 10.7 4.0 3.6 4.7 Hong Kong SAR -2.6 7.0 5.0 2.6 4.2 Singapore -1.0 14.8 4.9 2.7 3.9 Thailand -2.3 7.8 0.1 5.5 7.5 Malaysia -1.6 7.2 5.1 4.4 4.7 India 6.6 10.8 7.1 6.1 6.5 Africa 2.7 5.0 3.5 5.5 3.7 S & C America -1.6 6.2 4.5 3.4 4.2 WORLD -0.6 5.3 3.9 3.5 3.9 * Forecast, Source: IMF (July 2012) Forecast 2008 2009 2010 2011 ( e )2012 ( f) Iron Ore 841 898 992 1,051 1,112 7.9% 6.8% 10.4% 5.9% 5.9% Coking Coal 199 188 235 223 231 2.9% -5.8% 25.2% -5.0% 3.2% Steam Coal 577 589 663 720 762 3.5% 2.1% 12% 8.6% 5.9% Grains inc. s'beans 323 317 342 347 341 6.5% -1.8% 7.8% 1.4% -1.8% Other Bulks 1,271 1,139 1,308 1,421 1,473 -0.5% - 10.4% 14.8% 8.7% 3.6% 3,212 3,132 3,539 3,762 3,918 3.2% -2.5% 13.0% 6.3% 4.2% Crude 1,903 1,793 1,865 1,828 1,883 -0.1% -5.8% 4.0% -2.0% 3.0% Products 800 807 847 868 885 2.9% 0.9% 5.0% 2.5% 2.0% 2,702 2,599 2,712 2,695 2,768 0.7% -3.8% 4.3% -0.6% 2.7% Container Trade Europe 93 79 88 93 95 Asia 267 242 284 308 332 N.America 44 38 44 45 46 Others 92 89 91 97 103 Total (mTEU lifts) 496 448 507 543 577 137 125 141 151 159 4.2% -9.0% 12.8% 7.2% 5.5% Seaborne Trades (mt / mTEU) Total Dry Bulk Trades (mt ) Total Oil Trades (mt) Total Container Trade (mTEU ) Licensed to The Hong Kong Polytechnic University. Distribution is restricted; please remember to acknowledge the source. http://www.clarksons.net 01/11/2012 06:20:04 15304 Licensed to The Hong Kong Polytechnic University. Distribution is restricted; please remember to acknowledge the source. http://www.clarksons.net 01/11/2012 06:20:04 15304