正在加载图片...
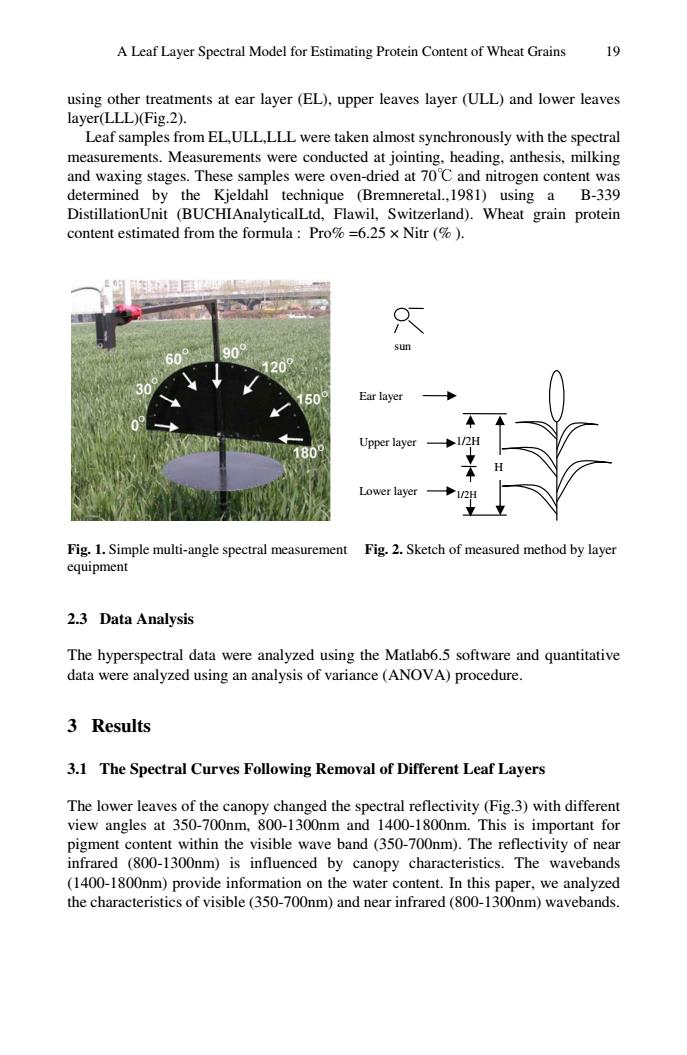
A Leaf Layer Spectral Model for Estimating Protein Content of Wheat Grains 19 using other trea ments at ear layer (EL).upper leaves layer (ULL)and lower leaves layer(LLL)(Fig.2). Leaf samples from EL,ULL,LLL were taken almost synchronously with the spectral measurements.Measurements were conducted at jointing,heading,anthesis,milking and waxing stages.These samples were oven-dried at 70C and nitrogen content was determined by the Kieldahl technique (Bremneretal.1981)using a B-339 DistillationUnit (BUCHIAnalyticalLtd,Flawil,Switzerland).Wheat grain protein content estimated from the formula:Pro%=6.25x Nitr(%) ar laye pper lav Fig.1.Simple multi-angle spectral measurement Fig.2.Sketch of measured method by layer 2.3 Data Analysis The hyperspectral data were analyzed using the Matlab6.5 software and quantitative data were analyzed using an analysis of variance (ANOVA)procedure. 3 Results 3.1 The Spectral Curves Following Removal of Different Leaf Layers The lower leaves of the canopy changed the spectral reflectivity (Fig.3)with different view angles at 350-700nm 800-1300nm and1400-1800nm This is ortant for 0-10m ntent within the visible wav e band (350-700nm).The tivity of n The waveband (1400-1800nm)provide information on the water content.In this paper,we analyzed the characteristics of visible (350-700nm)and near infrared(800-1300nm)wavebands.A Leaf Layer Spectral Model for Estimating Protein Content of Wheat Grains 19 using other treatments at ear layer (EL), upper leaves layer (ULL) and lower leaves layer(LLL)(Fig.2). Leaf samples from EL,ULL,LLL were taken almost synchronously with the spectral measurements. Measurements were conducted at jointing, heading, anthesis, milking and waxing stages. These samples were oven-dried at 70℃ and nitrogen content was determined by the Kjeldahl technique (Bremneretal.,1981) using a B-339 DistillationUnit (BUCHIAnalyticalLtd, Flawil, Switzerland). Wheat grain protein content estimated from the formula : Pro% =6.25 × Nitr (% ). Fig. 1. Simple multi-angle spectral measurement equipment Fig. 2. Sketch of measured method by layer 2.3 Data Analysis The hyperspectral data were analyzed using the Matlab6.5 software and quantitative data were analyzed using an analysis of variance (ANOVA) procedure. 3 Results 3.1 The Spectral Curves Following Removal of Different Leaf Layers The lower leaves of the canopy changed the spectral reflectivity (Fig.3) with different view angles at 350-700nm, 800-1300nm and 1400-1800nm. This is important for pigment content within the visible wave band (350-700nm). The reflectivity of near infrared (800-1300nm) is influenced by canopy characteristics. The wavebands (1400-1800nm) provide information on the water content. In this paper, we analyzed the characteristics of visible (350-700nm) and near infrared (800-1300nm) wavebands. Lower layer Upper layer 1/2H 1/2H H sun Ear layer