正在加载图片...
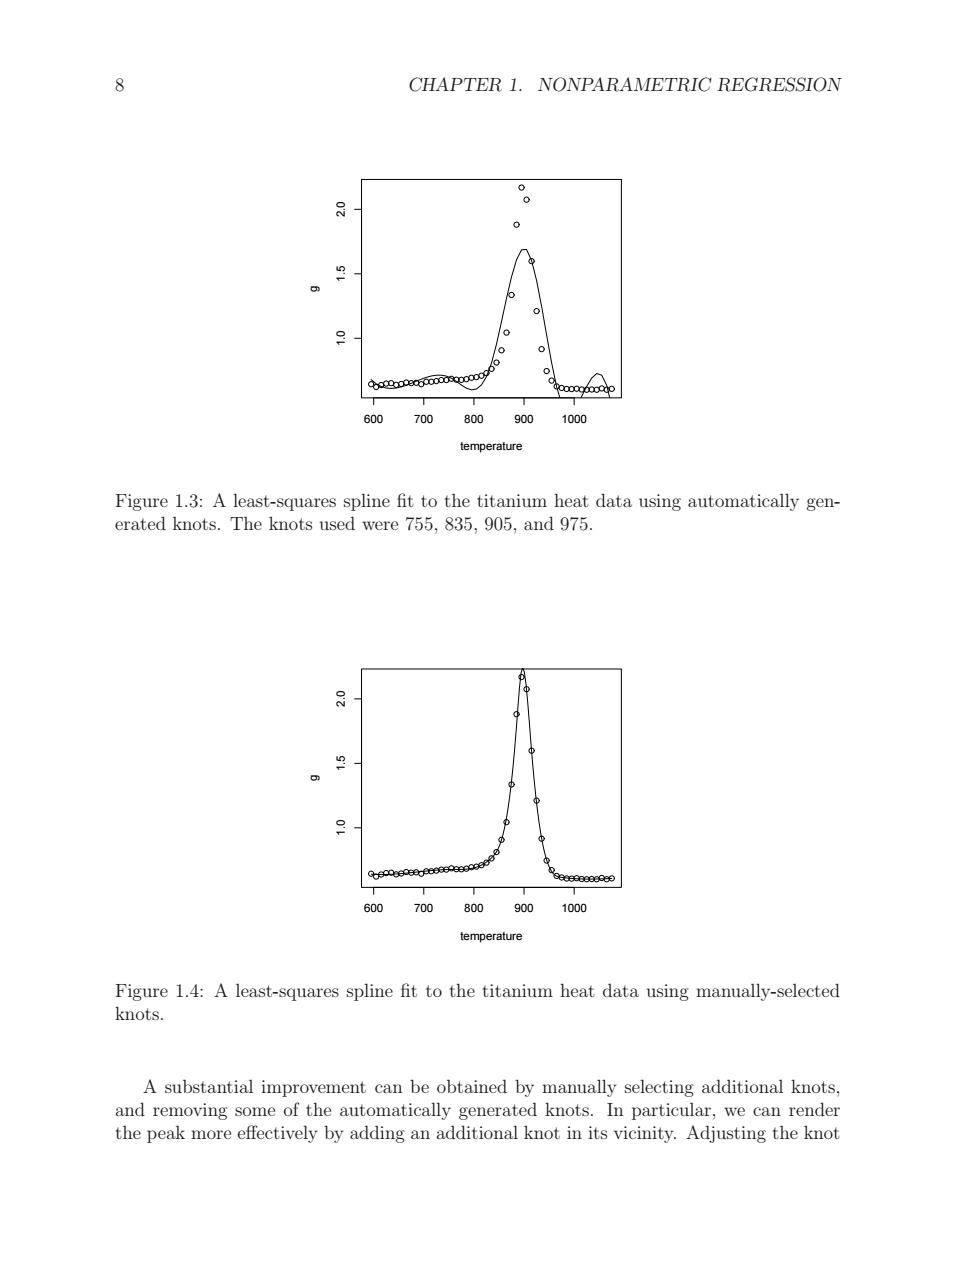
8 CHAPTER 1.NONPARAMETRIC REGRESSION 8 0 6 0 600700 800 900 1000 temperature Figure 1.3:A least-squares spline fit to the titanium heat data using automatically gen- erated knots.The knots used were 755,835,905,and 975. 0 600 700800900 1000 temperature Figure 1.4:A least-squares spline fit to the titanium heat data using manually-selected knots. A substantial improvement can be obtained by manually selecting additional knots, and removing some of the automatically generated knots.In particular,we can render the peak more effectively by adding an additional knot in its vicinity.Adjusting the knot8 CHAPTER 1. NONPARAMETRIC REGRESSION 600 700 800 900 1000 1.0 1.5 2.0 temperature g Figure 1.3: A least-squares spline fit to the titanium heat data using automatically generated knots. The knots used were 755, 835, 905, and 975. 600 700 800 900 1000 1.0 1.5 2.0 temperature g Figure 1.4: A least-squares spline fit to the titanium heat data using manually-selected knots. A substantial improvement can be obtained by manually selecting additional knots, and removing some of the automatically generated knots. In particular, we can render the peak more effectively by adding an additional knot in its vicinity. Adjusting the knot