正在加载图片...

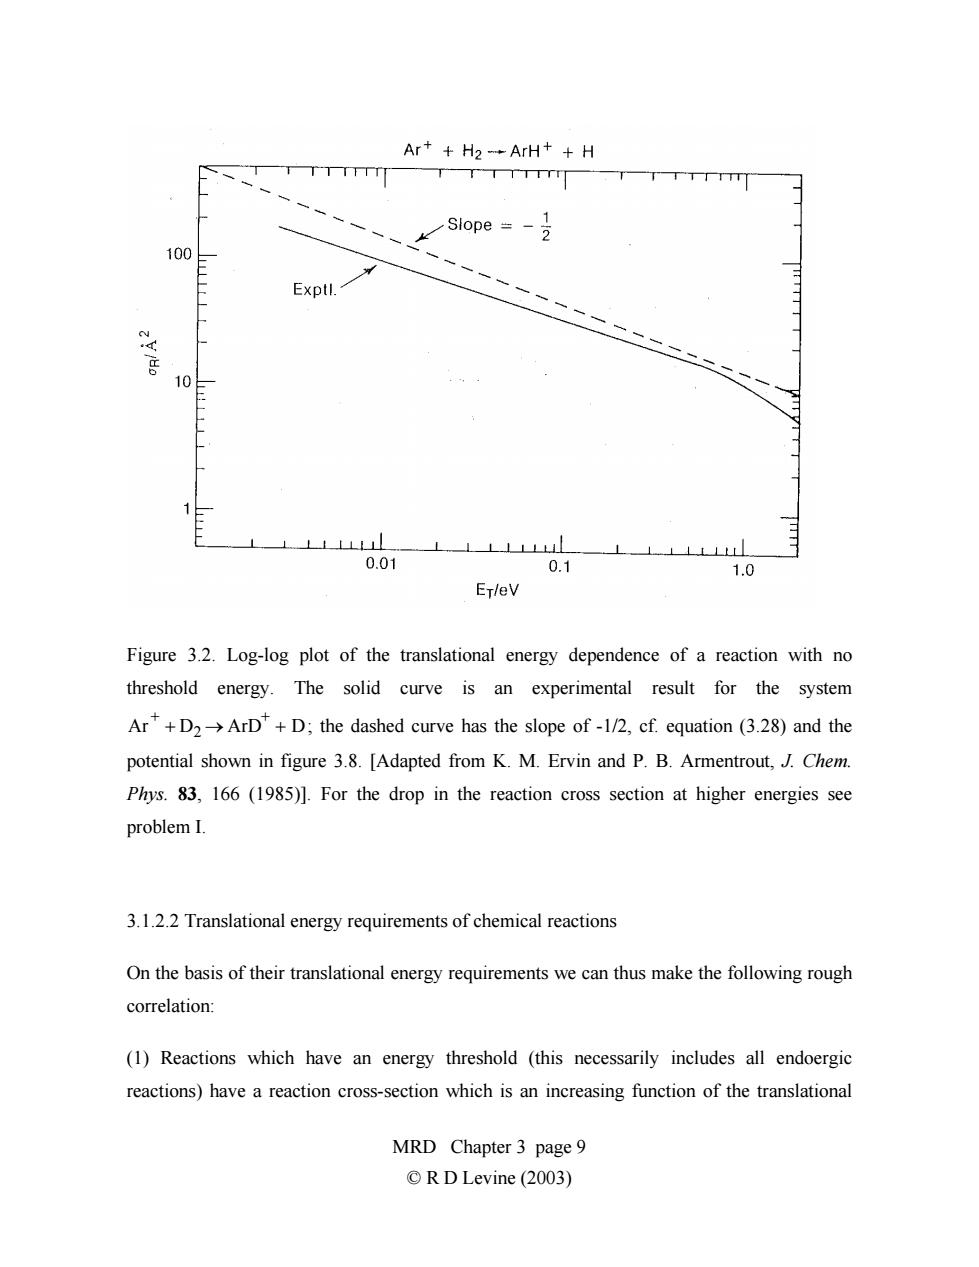
Art+H2→ArH++H TTTTTTTT 100 Exptl. 10 ⊥LL4L 0.01 0.1 1.0 ETleV Figure 3.2.Log-log plot of the translational energy dependence of a reaction with no threshold energy.The solid curve is an experimental result for the system Ar+D>ArD"+D;the dashed curve has the slope of -1/2,cf.equation (3.28)and the potential shown in figure 3.8.[Adapted from K.M.Ervin and P.B.Armentrout,J.Chem. Phys.83,166 (1985)].For the drop in the reaction cross section at higher energies see problem I. 3.1.2.2 Translational energy requirements of chemical reactions On the basis of their translational energy requirements we can thus make the following rough correlation: (1)Reactions which have an energy threshold (this necessarily includes all endoergic reactions)have a reaction cross-section which is an increasing function of the translational MRD Chapter 3 page 9 ©R D Levine(2003)Figure 3.2. Log-log plot of the translational energy dependence of a reaction with no threshold energy. The solid curve is an experimental result for the system ; the dashed curve has the slope of -1/2, cf. equation (3.28) and the potential shown in figure 3.8. [Adapted from K. M. Ervin and P. B. Armentrout, J. Chem. Phys. 83, 166 (1985)]. For the drop in the reaction cross section at higher energies see problem I. Ar+ + D2 → ArD+ + D 3.1.2.2 Translational energy requirements of chemical reactions On the basis of their translational energy requirements we can thus make the following rough correlation: (1) Reactions which have an energy threshold (this necessarily includes all endoergic reactions) have a reaction cross-section which is an increasing function of the translational MRD Chapter 3 page 9 © R D Levine (2003)