正在加载图片...
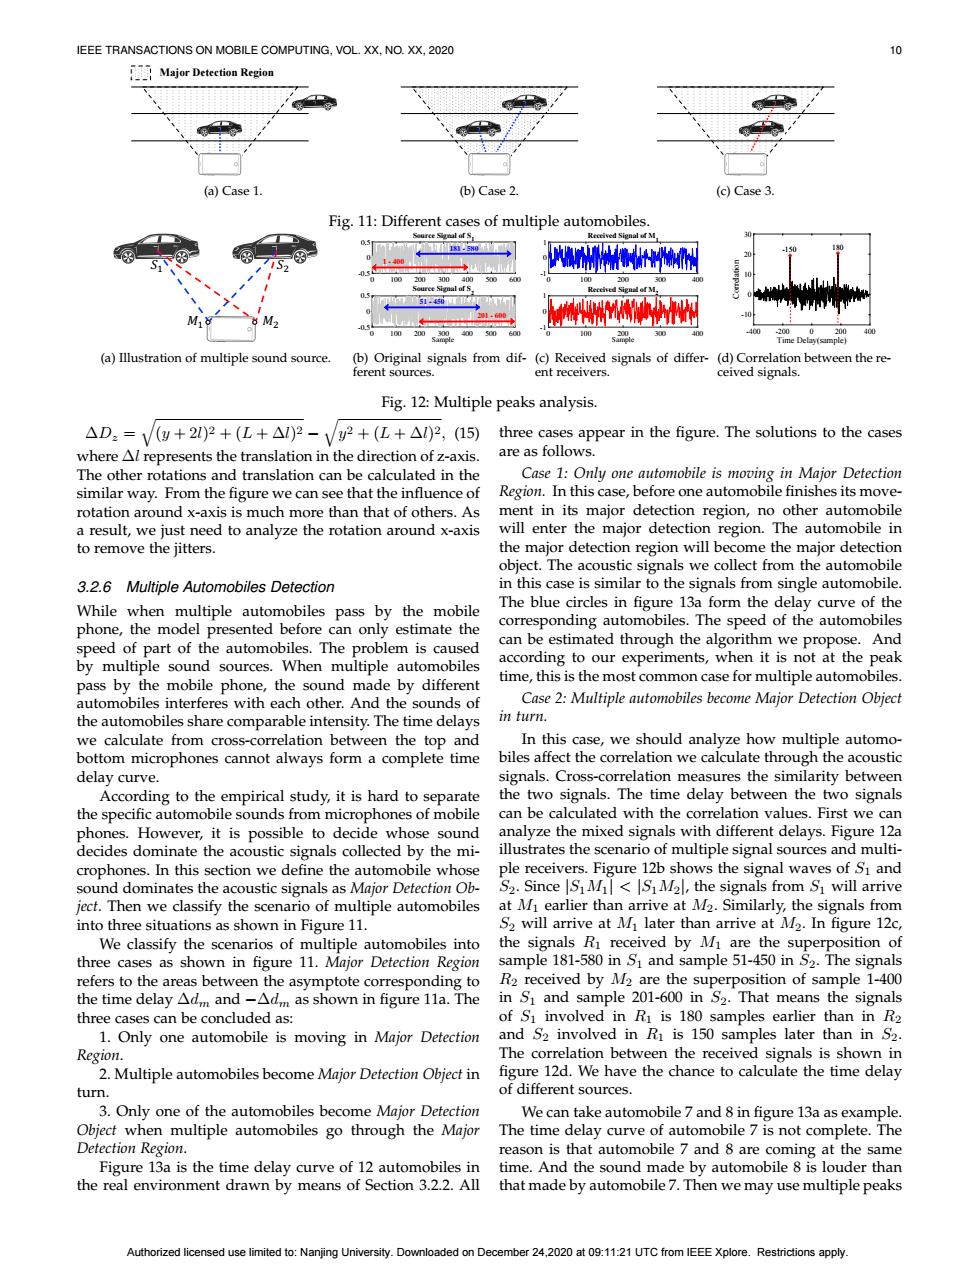
IEEE TRANSACTIONS ON MOBILE COMPUTING,VOL.XX.NO.XX,2020 10 Major Detection Region (a)Case 1. (b)Case 2. (c)Case 3. Fig.11:Different cases of multiple automobiles. Recived Signal of M 0 100 300 0.9 5.4o短 M18 0. 100200s302 400600 100 30D Time Dela (a)Illustration of multiple sound source. (b)Original signals from dif-(c)Received signals of differ-(d)Correlation between the re- ferent sources ent receivers. ceived signals. Fig.12:Multiple peaks analysis. △Dz=√/(y+2l)2+(L+△)2-V√y2+(L+△l)2,(15)three cases appear in the figure.The solutions to the cases where Al represents the translation in the direction of z-axis. are as follows. The other rotations and translation can be calculated in the Case 1:Only one automobile is moving in Major Detection similar way.From the figure we can see that the influence of Region.In this case,before one automobile finishes its move- rotation around x-axis is much more than that of others.As ment in its major detection region,no other automobile a result,we just need to analyze the rotation around x-axis will enter the major detection region.The automobile in to remove the jitters. the major detection region will become the major detection object.The acoustic signals we collect from the automobile 3.2.6 Multiple Automobiles Detection in this case is similar to the signals from single automobile. While when multiple automobiles pass by the mobile The blue circles in figure 13a form the delay curve of the phone,the model presented before can only estimate the corresponding automobiles.The speed of the automobiles speed of part of the automobiles.The problem is caused can be estimated through the algorithm we propose.And by multiple sound sources.When multiple automobiles according to our experiments,when it is not at the peak pass by the mobile phone,the sound made by different time,this is the most common case for multiple automobiles. automobiles interferes with each other.And the sounds of Case 2:Multiple automobiles become Major Detection Obiect the automobiles share comparable intensity.The time delays in turn. we calculate from cross-correlation between the top and In this case,we should analyze how multiple automo- bottom microphones cannot always form a complete time biles affect the correlation we calculate through the acoustic delay curve. signals.Cross-correlation measures the similarity between According to the empirical study,it is hard to separate the two signals.The time delay between the two signals the specific automobile sounds from microphones of mobile can be calculated with the correlation values.First we can phones.However,it is possible to decide whose sound analyze the mixed signals with different delays.Figure 12a decides dominate the acoustic signals collected by the mi- illustrates the scenario of multiple signal sources and multi- crophones.In this section we define the automobile whose ple receivers.Figure 12b shows the signal waves of S1 and sound dominates the acoustic signals as Major Detection Ob- S2.Since S1Mi<S1M2l,the signals from S1 will arrive ject.Then we classify the scenario of multiple automobiles at Mi earlier than arrive at M2.Similarly,the signals from into three situations as shown in Figure 11. S2 will arrive at M later than arrive at M2.In figure 12c, We classify the scenarios of multiple automobiles into the signals Ri received by Mi are the superposition of three cases as shown in figure 11.Major Detection Region sample 181-580 in S1 and sample 51-450 in S2.The signals refers to the areas between the asymptote corresponding to R2 received by M2 are the superposition of sample 1-400 the time delay Adm and-Adm as shown in figure 11a.The in S1 and sample 201-600 in S2.That means the signals three cases can be concluded as: of S1 involved in R is 180 samples earlier than in R2 1.Only one automobile is moving in Major Detection and S2 involved in R1 is 150 samples later than in S2. Region. The correlation between the received signals is shown in 2.Multiple automobiles become Major Detection Object in figure 12d.We have the chance to calculate the time delay turn. of different sources. 3.Only one of the automobiles become Major Detection We can take automobile 7 and 8 in figure 13a as example. Object when multiple automobiles go through the Major The time delay curve of automobile 7 is not complete.The Detection Region. reason is that automobile 7 and 8 are coming at the same Figure 13a is the time delay curve of 12 automobiles in time.And the sound made by automobile 8 is louder than the real environment drawn by means of Section 3.2.2.All that made by automobile 7.Then we may use multiple peaks Authorized licensed use limited to:Nanjing University.Downloaded on December 24,2020 at 09:11:21 UTC from IEEE Xplore.Restrictions applyIEEE TRANSACTIONS ON MOBILE COMPUTING, VOL. XX, NO. XX, 2020 10 Major Detection Region (a) Case 1. Major Detection Region (b) Case 2. Major Detection Region (c) Case 3. Fig. 11: Different cases of multiple automobiles. �" �# �" �# (a) Illustration of multiple sound source. 0 100 200 300 400 500 600 -0.5 0 0.5 Source Signal of S1 0 100 200 300 400 500 600 Sample -0.5 0 0.5 Source Signal of S2 201 - 600 181 - 580 51 - 450 1 - 400 (b) Original signals from different sources. 0 100 200 300 400 -1 0 1 Received Signal of M1 0 100 200 300 400 Sample -1 0 1 Received Signal of M2 (c) Received signals of different receivers. -400 -200 0 200 400 Time Delay(sample) -10 0 10 20 30 Correlation 180 -150 (d) Correlation between the received signals. Fig. 12: Multiple peaks analysis. ∆Dz = q (y + 2l) 2 + (L + ∆l) 2 − q y 2 + (L + ∆l) 2, (15) where ∆l represents the translation in the direction of z-axis. The other rotations and translation can be calculated in the similar way. From the figure we can see that the influence of rotation around x-axis is much more than that of others. As a result, we just need to analyze the rotation around x-axis to remove the jitters. 3.2.6 Multiple Automobiles Detection While when multiple automobiles pass by the mobile phone, the model presented before can only estimate the speed of part of the automobiles. The problem is caused by multiple sound sources. When multiple automobiles pass by the mobile phone, the sound made by different automobiles interferes with each other. And the sounds of the automobiles share comparable intensity. The time delays we calculate from cross-correlation between the top and bottom microphones cannot always form a complete time delay curve. According to the empirical study, it is hard to separate the specific automobile sounds from microphones of mobile phones. However, it is possible to decide whose sound decides dominate the acoustic signals collected by the microphones. In this section we define the automobile whose sound dominates the acoustic signals as Major Detection Object. Then we classify the scenario of multiple automobiles into three situations as shown in Figure 11. We classify the scenarios of multiple automobiles into three cases as shown in figure 11. Major Detection Region refers to the areas between the asymptote corresponding to the time delay ∆dm and −∆dm as shown in figure 11a. The three cases can be concluded as: 1. Only one automobile is moving in Major Detection Region. 2. Multiple automobiles become Major Detection Object in turn. 3. Only one of the automobiles become Major Detection Object when multiple automobiles go through the Major Detection Region. Figure 13a is the time delay curve of 12 automobiles in the real environment drawn by means of Section 3.2.2. All three cases appear in the figure. The solutions to the cases are as follows. Case 1: Only one automobile is moving in Major Detection Region. In this case, before one automobile finishes its movement in its major detection region, no other automobile will enter the major detection region. The automobile in the major detection region will become the major detection object. The acoustic signals we collect from the automobile in this case is similar to the signals from single automobile. The blue circles in figure 13a form the delay curve of the corresponding automobiles. The speed of the automobiles can be estimated through the algorithm we propose. And according to our experiments, when it is not at the peak time, this is the most common case for multiple automobiles. Case 2: Multiple automobiles become Major Detection Object in turn. In this case, we should analyze how multiple automobiles affect the correlation we calculate through the acoustic signals. Cross-correlation measures the similarity between the two signals. The time delay between the two signals can be calculated with the correlation values. First we can analyze the mixed signals with different delays. Figure 12a illustrates the scenario of multiple signal sources and multiple receivers. Figure 12b shows the signal waves of S1 and S2. Since |S1M1| < |S1M2|, the signals from S1 will arrive at M1 earlier than arrive at M2. Similarly, the signals from S2 will arrive at M1 later than arrive at M2. In figure 12c, the signals R1 received by M1 are the superposition of sample 181-580 in S1 and sample 51-450 in S2. The signals R2 received by M2 are the superposition of sample 1-400 in S1 and sample 201-600 in S2. That means the signals of S1 involved in R1 is 180 samples earlier than in R2 and S2 involved in R1 is 150 samples later than in S2. The correlation between the received signals is shown in figure 12d. We have the chance to calculate the time delay of different sources. We can take automobile 7 and 8 in figure 13a as example. The time delay curve of automobile 7 is not complete. The reason is that automobile 7 and 8 are coming at the same time. And the sound made by automobile 8 is louder than that made by automobile 7. Then we may use multiple peaks Authorized licensed use limited to: Nanjing University. Downloaded on December 24,2020 at 09:11:21 UTC from IEEE Xplore. Restrictions apply