正在加载图片...

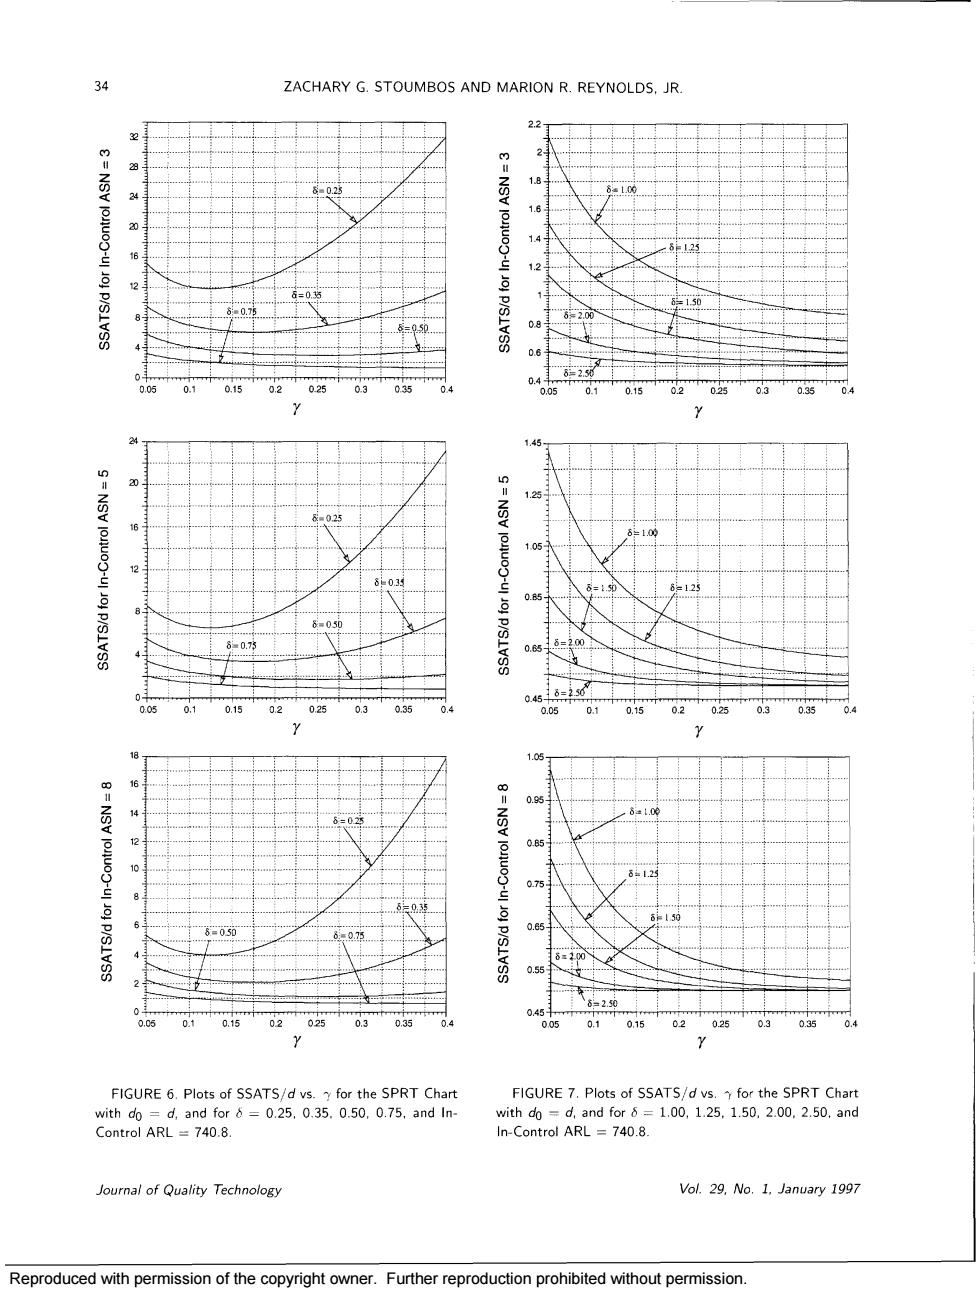
34 ZACHARY G.STOUMBOS AND MARION R.REYNOLDS.JR. 2 p/s 0.1 0.15 03 035 0.1 0.1 02 01 015 02 025 03 0 FIGURE 6.Plots of SSATS/d vs.for the SPRT Chart FIGURE 7.Plots of SSATS/d vs.Y for the SPRT Chart with do= d,and for6=0.25.0.35.0.50.0.75.and In- mthd=d.and for=1.0,1.25,1.50,200,2.50,and Control ARL=740.8. In-Control ARL 740.8 Journal of Quality Technology Vol.29.No.1.January 1997 Reproduced with permission of the copyright owner.Further reproduction prohibited without permission. Reproduced with permission of the copyright owner. Further reproduction prohibited without permission