正在加载图片...
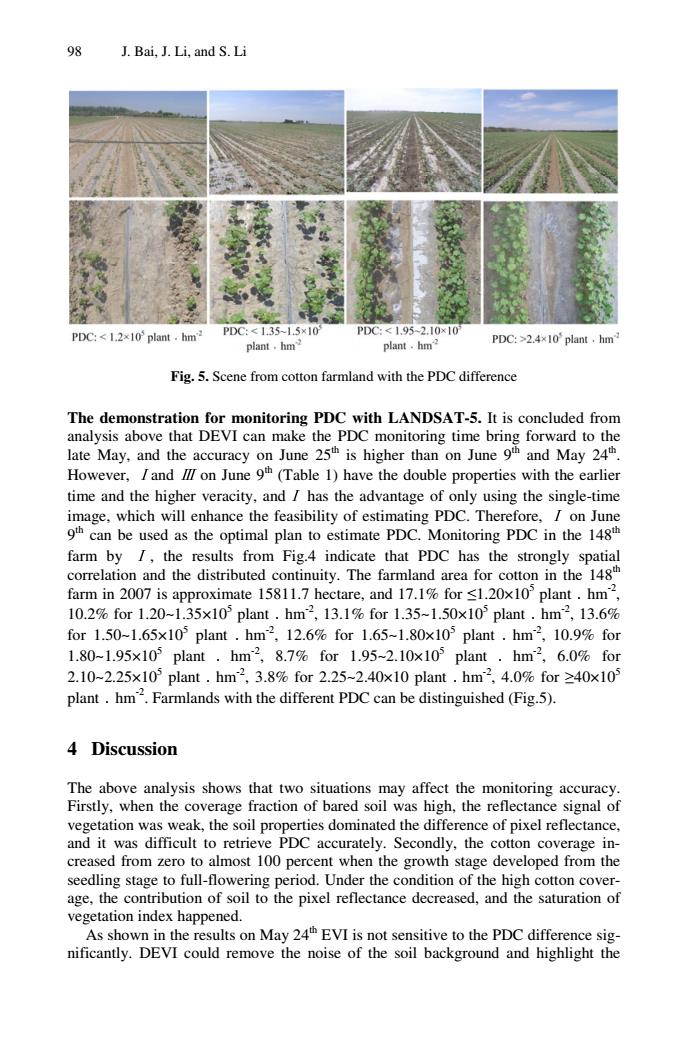
98 J.Bai,J.Li,and S.Li PDC:<1.2x10plant.hm .hm PDC:>.x10plant.hm Fig.5.Scene from cotton farmland with the PDC difference The demonstration for montoring PDC with LANDSAT-5.It is conedom malysis abo ove that devi can e the pDC n ng time bring rd t late May, and th n on June and May 24 (Table D)have the double propertieswth the time and the higher veracity,and has the advantage of only using the single-time whch will enhance the feasibility of estimating PDC.Therefore. an be used as the optimal plan estimate PDC.Monitoring PDC in the 14 o n te tuue nly he amle farm in 2007 is approximate 15811.7 hectare,and 17.1%for s1.20x10'plant.hm 10.2%for1.20-1.35x10⁵ plant.hm2,13.1%for1.35-1.50x10⁵ plant.hm2,13.6% for 1.50-1.65x10⁵ plant. hm2,12.6%for1.65-1.80x10³ plant.hm2,10.9%fo 1.80-1.95x10 plant.hm2,8.7%for1.95-2.10x10⁵ plant.hm2,6.09%for 2.10-2.25x10⁵ plant.hm2,3.8%for2.25-2.40x10 plant.hm2,4.0%for≥40x105 plant.hmFarmlands with the different PDCcan be distinguished (Fig.5) 4 Discussion The above Firstly a e afet the gh,the reflecta vegetation wa the s rties dom fference of pixel reflectance and it was difficult to retriev PDC accurately. Secondly,the cotton co erage m crea sed from zero to almost 100 percent when the growth stage developed from the seedling stage to full-flowering period.Under the condition of the high cotton cover age,the contribution of soil to the pixel reflectance decreased,and the saturation of vegetation index happened. As shown in the results on May 24EVI is not sensitive to the PDC difference sig- nificantly.DEVI could remove the noise of the soil background and highlight the 98 J. Bai, J. Li, and S. Li Fig. 5. Scene from cotton farmland with the PDC difference The demonstration for monitoring PDC with LANDSAT-5. It is concluded from analysis above that DEVI can make the PDC monitoring time bring forward to the late May, and the accuracy on June 25th is higher than on June 9th and May 24th. However, Ⅰand Ⅲ on June 9th (Table 1) have the double properties with the earlier time and the higher veracity, andⅠ has the advantage of only using the single-time image, which will enhance the feasibility of estimating PDC. Therefore, Ⅰ on June 9th can be used as the optimal plan to estimate PDC. Monitoring PDC in the 148th farm by Ⅰ , the results from Fig.4 indicate that PDC has the strongly spatial correlation and the distributed continuity. The farmland area for cotton in the 148th farm in 2007 is approximate 15811.7 hectare, and 17.1% for ≤1.20×10⁵ plant﹒hm-2, 10.2% for 1.20~1.35×10⁵ plant﹒hm-2, 13.1% for 1.35~1.50×10⁵ plant﹒hm-2, 13.6% for 1.50~1.65×10⁵ plant﹒hm-2, 12.6% for 1.65~1.80×10⁵ plant﹒hm-2, 10.9% for 1.80~1.95×10⁵ plant ﹒ hm-2, 8.7% for 1.95~2.10×10⁵ plant ﹒ hm-2, 6.0% for 2.10~2.25×10⁵ plant﹒hm-2, 3.8% for 2.25~2.40×10 plant﹒hm-2, 4.0% for ≥40×105 plant﹒hm-2. Farmlands with the different PDC can be distinguished (Fig.5). 4 Discussion The above analysis shows that two situations may affect the monitoring accuracy. Firstly, when the coverage fraction of bared soil was high, the reflectance signal of vegetation was weak, the soil properties dominated the difference of pixel reflectance, and it was difficult to retrieve PDC accurately. Secondly, the cotton coverage increased from zero to almost 100 percent when the growth stage developed from the seedling stage to full-flowering period. Under the condition of the high cotton coverage, the contribution of soil to the pixel reflectance decreased, and the saturation of vegetation index happened. As shown in the results on May 24th EVI is not sensitive to the PDC difference significantly. DEVI could remove the noise of the soil background and highlight the