正在加载图片...

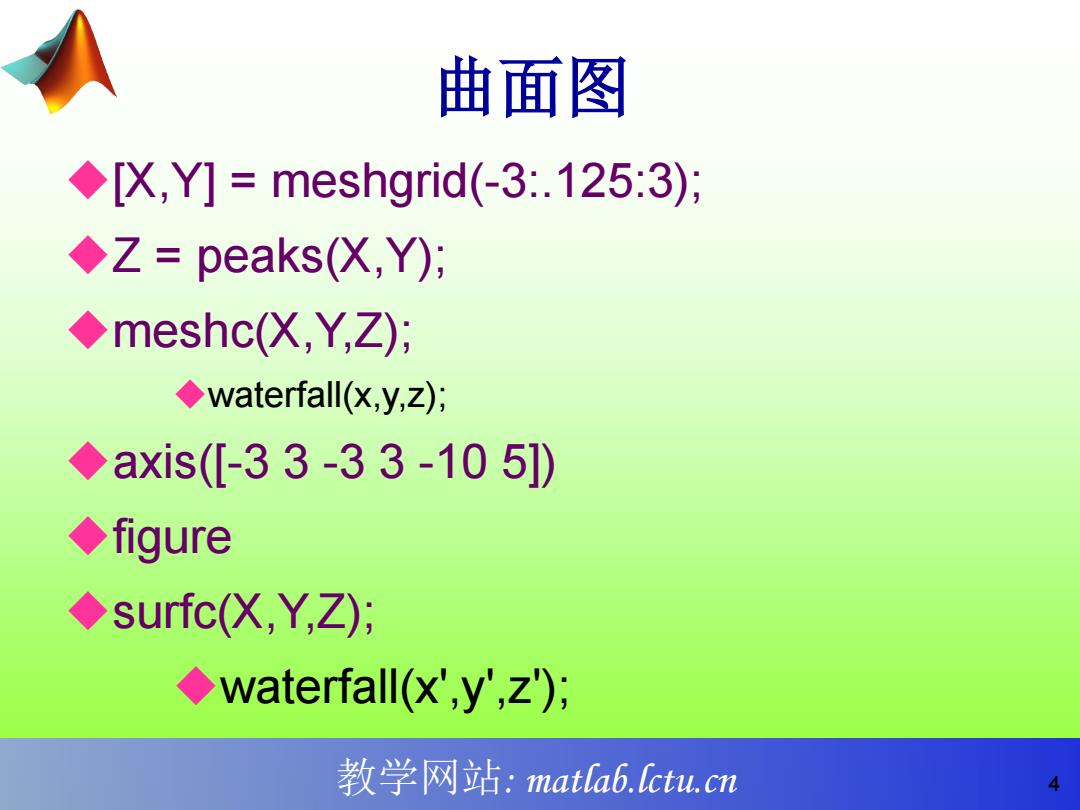
曲面图 [X,Y]meshgrid(-3:.125:3); ◆Z=peaks(X,Y); ◆meshc(X,Y,Z); ◆waterfall(x,y,z); ◆axis(-33-33-105]) ◆figure ◆surfc(X,Y,Z); waterfall(x',y',z); 教学网站:mata6.fctu.cn教学网站: matlab.lctu.cn 4 曲面图 [X,Y] = meshgrid(-3:.125:3); Z = peaks(X,Y); meshc(X,Y,Z); waterfall(x,y,z); axis([-3 3 -3 3 -10 5]) figure surfc(X,Y,Z); waterfall(x',y',z');