正在加载图片...

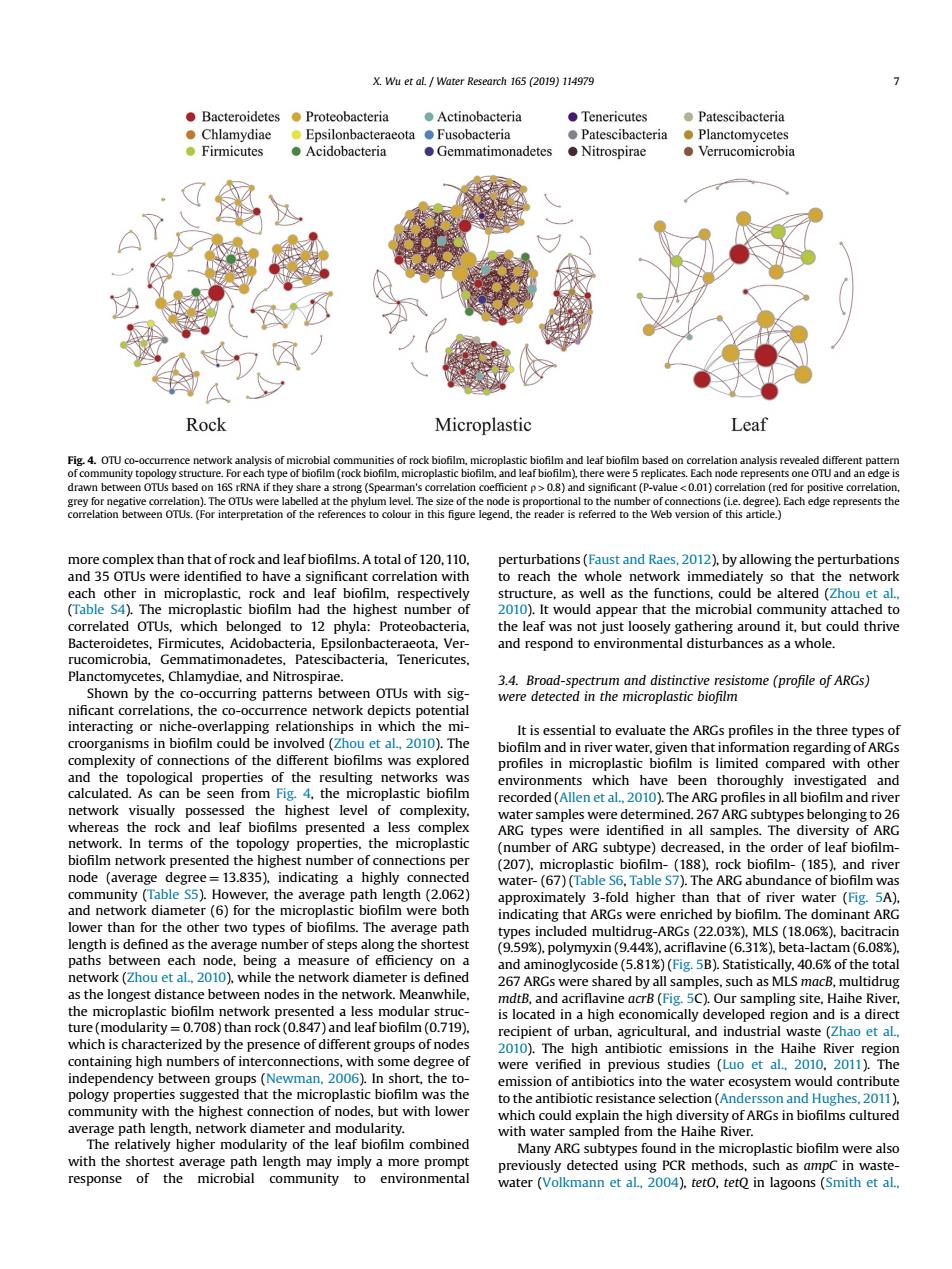
●Bacteroidetes●Proteobacteria●Actinobacteria ●Tenericutes ●Patescibacteria Rock Microplastic en OTUs based on tey share a m25mctanhatoftockndleafbofims.Atotalof120,10 perturbations(Faust and Raes.2012)by allowing the perturbations e cture.as well as the functions.couldbe altered (Zhou t ongcaohal2tphghetnmbcro and respond to environmental disturbances as a whole. (e) et al 2010 xity of conne biofilm is mited compared with o the ne ecorded ().The ARG fles in all biofilm and oro ns pe ver,the average w. 18g in the order (185 )(Table 1gth2.06 abundance of that 5A) ARGs were vine(6.31%).b ctam (6.08% ork (Zho diet al. microplastic bi which is characterized by the presence of different groupsof node the (Zhao et al wman,20061 studiesLuo et a e o the antibiotic resistanc vith water sam water (olkmn et)tet tein lagoons (Smith etmore complex than that of rock and leaf biofilms. A total of 120, 110, and 35 OTUs were identified to have a significant correlation with each other in microplastic, rock and leaf biofilm, respectively (Table S4). The microplastic biofilm had the highest number of correlated OTUs, which belonged to 12 phyla: Proteobacteria, Bacteroidetes, Firmicutes, Acidobacteria, Epsilonbacteraeota, Verrucomicrobia, Gemmatimonadetes, Patescibacteria, Tenericutes, Planctomycetes, Chlamydiae, and Nitrospirae. Shown by the co-occurring patterns between OTUs with significant correlations, the co-occurrence network depicts potential interacting or niche-overlapping relationships in which the microorganisms in biofilm could be involved (Zhou et al., 2010). The complexity of connections of the different biofilms was explored and the topological properties of the resulting networks was calculated. As can be seen from Fig. 4, the microplastic biofilm network visually possessed the highest level of complexity, whereas the rock and leaf biofilms presented a less complex network. In terms of the topology properties, the microplastic biofilm network presented the highest number of connections per node (average degree ¼ 13.835), indicating a highly connected community (Table S5). However, the average path length (2.062) and network diameter (6) for the microplastic biofilm were both lower than for the other two types of biofilms. The average path length is defined as the average number of steps along the shortest paths between each node, being a measure of efficiency on a network (Zhou et al., 2010), while the network diameter is defined as the longest distance between nodes in the network. Meanwhile, the microplastic biofilm network presented a less modular structure (modularity ¼ 0.708) than rock (0.847) and leaf biofilm (0.719), which is characterized by the presence of different groups of nodes containing high numbers of interconnections, with some degree of independency between groups (Newman, 2006). In short, the topology properties suggested that the microplastic biofilm was the community with the highest connection of nodes, but with lower average path length, network diameter and modularity. The relatively higher modularity of the leaf biofilm combined with the shortest average path length may imply a more prompt response of the microbial community to environmental perturbations (Faust and Raes, 2012), by allowing the perturbations to reach the whole network immediately so that the network structure, as well as the functions, could be altered (Zhou et al., 2010). It would appear that the microbial community attached to the leaf was not just loosely gathering around it, but could thrive and respond to environmental disturbances as a whole. 3.4. Broad-spectrum and distinctive resistome (profile of ARGs) were detected in the microplastic biofilm It is essential to evaluate the ARGs profiles in the three types of biofilm and in river water, given that information regarding of ARGs profiles in microplastic biofilm is limited compared with other environments which have been thoroughly investigated and recorded (Allen et al., 2010). The ARG profiles in all biofilm and river water samples were determined. 267 ARG subtypes belonging to 26 ARG types were identified in all samples. The diversity of ARG (number of ARG subtype) decreased, in the order of leaf biofilm- (207), microplastic biofilm- (188), rock biofilm- (185), and river water- (67) (Table S6, Table S7). The ARG abundance of biofilm was approximately 3-fold higher than that of river water (Fig. 5A), indicating that ARGs were enriched by biofilm. The dominant ARG types included multidrug-ARGs (22.03%), MLS (18.06%), bacitracin (9.59%), polymyxin (9.44%), acriflavine (6.31%), beta-lactam (6.08%), and aminoglycoside (5.81%) (Fig. 5B). Statistically, 40.6% of the total 267 ARGs were shared by all samples, such as MLS macB, multidrug mdtB, and acriflavine acrB (Fig. 5C). Our sampling site, Haihe River, is located in a high economically developed region and is a direct recipient of urban, agricultural, and industrial waste (Zhao et al., 2010). The high antibiotic emissions in the Haihe River region were verified in previous studies (Luo et al., 2010, 2011). The emission of antibiotics into the water ecosystem would contribute to the antibiotic resistance selection (Andersson and Hughes, 2011), which could explain the high diversity of ARGs in biofilms cultured with water sampled from the Haihe River. Many ARG subtypes found in the microplastic biofilm were also previously detected using PCR methods, such as ampC in wastewater (Volkmann et al., 2004), tetO, tetQ in lagoons (Smith et al., Fig. 4. OTU co-occurrence network analysis of microbial communities of rock biofilm, microplastic biofilm and leaf biofilm based on correlation analysis revealed different pattern of community topology structure. For each type of biofilm (rock biofilm, microplastic biofilm, and leaf biofilm), there were 5 replicates. Each node represents one OTU and an edge is drawn between OTUs based on 16S rRNA if they share a strong (Spearman's correlation coefficient r > 0.8) and significant (P-value < 0.01) correlation (red for positive correlation, grey for negative correlation). The OTUs were labelled at the phylum level. The size of the node is proportional to the number of connections (i.e. degree). Each edge represents the correlation between OTUs. (For interpretation of the references to colour in this figure legend, the reader is referred to the Web version of this article.) X. Wu et al. / Water Research 165 (2019) 114979 7