正在加载图片...
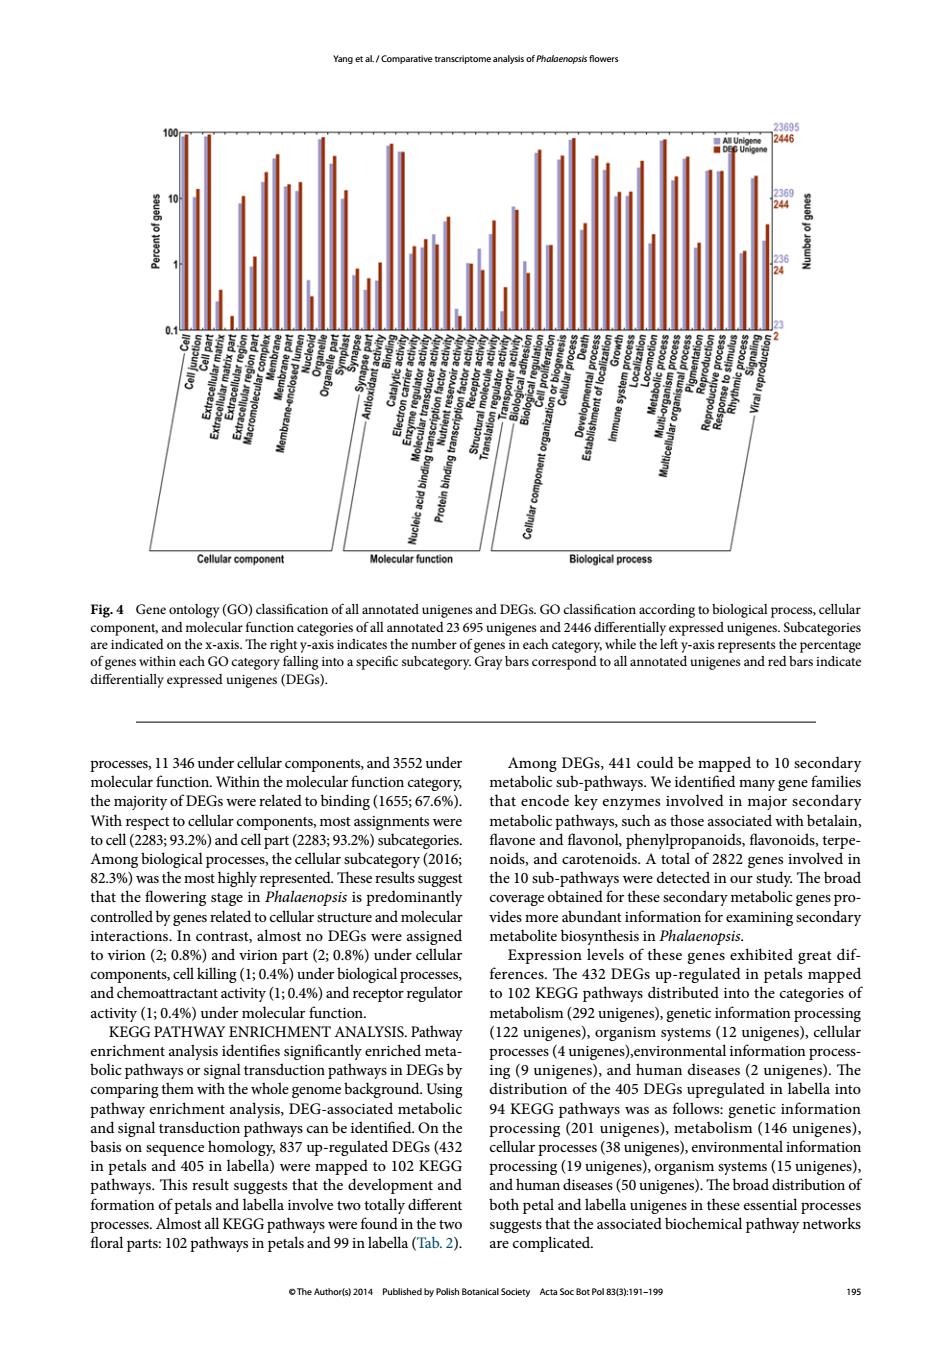
Yang et al/Comparative transcriptome analysis of Phalaenopsis flowers Un Cellular component Molecular function Biological process Fig.4 Gene ontology(GO)classification of all annotated unigenes and DEGs.GO classification according to biological process,cellular component,and molecular function categories of all annotated 23 695 unigenes and 2446 differentially expressed unigenes.Subcategories are indicated on the x-axis.The right y-axis indicates the number of genes in each category,while the left y-axis represents the percentage of genes within each GO category falling into a specific subcategory.Gray bars correspond to all annotated unigenes and red bars indicate differentially expressed unigenes(DEGs). processes,11 346 under cellular components,and 3552 under Among DEGs,441 could be mapped to 10 secondary molecular function.Within the molecular function category, metabolic sub-pathways.We identified many gene families the majority of DEGs were related to binding (1655;67.6%). that encode key enzymes involved in major secondary With respect to cellular components,most assignments were metabolic pathways,such as those associated with betalain, to cell(2283;93.2%)and cell part(2283;93.2%)subcategories. flavone and flavonol,phenylpropanoids,flavonoids,terpe- Among biological processes,the cellular subcategory(2016; noids,and carotenoids.A total of 2822 genes involved in 82.3%)was the most highly represented.These results suggest the 10 sub-pathways were detected in our study.The broad that the flowering stage in Phalaenopsis is predominantly coverage obtained for these secondary metabolic genes pro- controlled by genes related to cellular structure and molecular vides more abundant information for examining secondary interactions.In contrast,almost no DEGs were assigned metabolite biosynthesis in Phalaenopsis. to virion (2;0.8%)and virion part(2;0.8%)under cellular Expression levels of these genes exhibited great dif- components,cell killing(1;0.4%)under biological processes, ferences.The 432 DEGs up-regulated in petals mapped and chemoattractant activity(1;0.4%)and receptor regulator to 102 KEGG pathways distributed into the categories of activity (1;0.4%)under molecular function. metabolism(292 unigenes),genetic information processing KEGG PATHWAY ENRICHMENT ANALYSIS.Pathway (122 unigenes),organism systems(12 unigenes),cellular enrichment analysis identifies significantly enriched meta- processes(4 unigenes),environmental information process- bolic pathways or signal transduction pathways in dEGs by ing(9 unigenes),and human diseases(2 unigenes).The comparing them with the whole genome background.Using distribution of the 405 DEGs upregulated in labella into pathway enrichment analysis,DEG-associated metabolic 94 KEGG pathways was as follows:genetic information and signal transduction pathways can be identified.On the processing(201 unigenes),metabolism(146 unigenes), basis on sequence homology,837 up-regulated DEGs(432 cellular processes(38 unigenes),environmental information in petals and 405 in labella)were mapped to 102 KEGG processing(19 unigenes),organism systems(15 unigenes), pathways.This result suggests that the development and and human diseases(50 unigenes).The broad distribution of formation of petals and labella involve two totally different both petal and labella unigenes in these essential processes processes.Almost all KEGG pathways were found in the two suggests that the associated biochemical pathway networks floral parts:102 pathways in petals and 99 in labella(Tab.2). are complicated. The Author(s)2014 Published by Polish Botanical Soclety Acta Soc Bot Pol 83(3):191-199 195© The Author(s) 2014 Published by Polish Botanical Society Acta Soc Bot Pol 83(3):191–199 195 Yang et al. / Comparative transcriptome analysis of Phalaenopsis flowers processes, 11 346 under cellular components, and 3552 under molecular function. Within the molecular function category, the majority of DEGs were related to binding (1655; 67.6%). With respect to cellular components, most assignments were to cell (2283; 93.2%) and cell part (2283; 93.2%) subcategories. Among biological processes, the cellular subcategory (2016; 82.3%) was the most highly represented. These results suggest that the flowering stage in Phalaenopsis is predominantly controlled by genes related to cellular structure and molecular interactions. In contrast, almost no DEGs were assigned to virion (2; 0.8%) and virion part (2; 0.8%) under cellular components, cell killing (1; 0.4%) under biological processes, and chemoattractant activity (1; 0.4%) and receptor regulator activity (1; 0.4%) under molecular function. KEGG PATHWAY ENRICHMENT ANALYSIS. Pathway enrichment analysis identifies significantly enriched metabolic pathways or signal transduction pathways in DEGs by comparing them with the whole genome background. Using pathway enrichment analysis, DEG-associated metabolic and signal transduction pathways can be identified. On the basis on sequence homology, 837 up-regulated DEGs (432 in petals and 405 in labella) were mapped to 102 KEGG pathways. This result suggests that the development and formation of petals and labella involve two totally different processes. Almost all KEGG pathways were found in the two floral parts: 102 pathways in petals and 99 in labella (Tab. 2). Among DEGs, 441 could be mapped to 10 secondary metabolic sub-pathways. We identified many gene families that encode key enzymes involved in major secondary metabolic pathways, such as those associated with betalain, flavone and flavonol, phenylpropanoids, flavonoids, terpenoids, and carotenoids. A total of 2822 genes involved in the 10 sub-pathways were detected in our study. The broad coverage obtained for these secondary metabolic genes provides more abundant information for examining secondary metabolite biosynthesis in Phalaenopsis. Expression levels of these genes exhibited great differences. The 432 DEGs up-regulated in petals mapped to 102 KEGG pathways distributed into the categories of metabolism (292 unigenes), genetic information processing (122 unigenes), organism systems (12 unigenes), cellular processes (4 unigenes),environmental information processing (9 unigenes), and human diseases (2 unigenes). The distribution of the 405 DEGs upregulated in labella into 94 KEGG pathways was as follows: genetic information processing (201 unigenes), metabolism (146 unigenes), cellular processes (38 unigenes), environmental information processing (19 unigenes), organism systems (15 unigenes), and human diseases (50 unigenes). The broad distribution of both petal and labella unigenes in these essential processes suggests that the associated biochemical pathway networks are complicated. Fig. 4 Gene ontology (GO) classification of all annotated unigenes and DEGs. GO classification according to biological process, cellular component, and molecular function categories of all annotated 23 695 unigenes and 2446 differentially expressed unigenes. Subcategories are indicated on the x-axis. The right y-axis indicates the number of genes in each category, while the left y-axis represents the percentage of genes within each GO category falling into a specific subcategory. Gray bars correspond to all annotated unigenes and red bars indicate differentially expressed unigenes (DEGs)