正在加载图片...
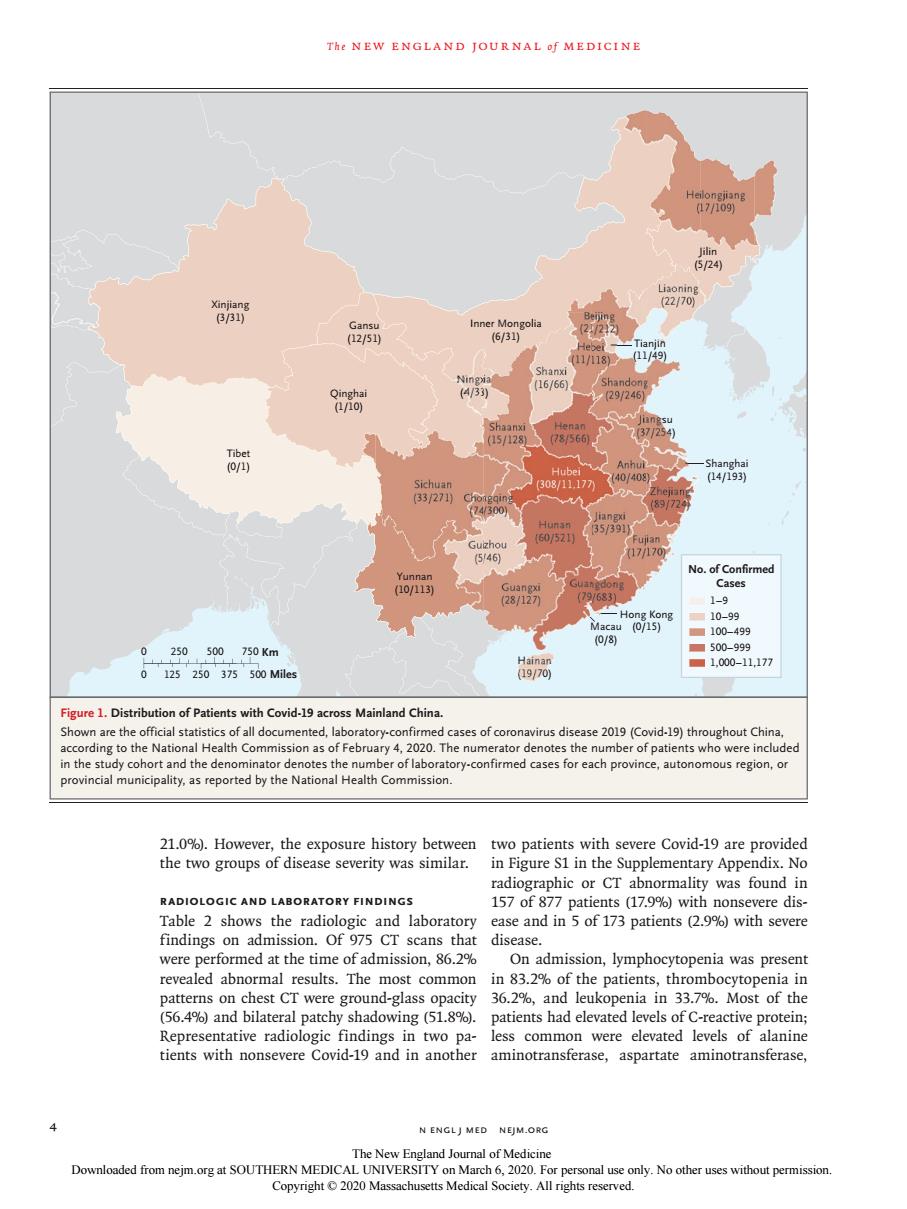
Thr NEW ENGLAND JOURNAL f MEDICINE 251 015 97 .191 to the National Health Co ion as of February 4.2020.Thenun ator the pPoncanCphiesedbyH2witehcacfhtomorceonimedaciorcachproincauianomoasegono mentary appendix no radiographic or CT abnormality was found in RADIOLOGIC AND LABORATORY FINDINGS 157 of 877 patients (179%)with nonsevere dis- Table 2 shows the radiologi c and laboratory ease and in 5 of 173 patients (2.9%)with severe findings on adn 0n. 0f97 disease were a was presen nia (56.4%)and bilateral patchy shadowing (518%) atients had elevated levels of c-reactive protein Representative radiologie findings in two pa less common were elevated levels of alanine tients with nonsevere Covid-19 and in another aminotransferase,aspartate aminotransferase. N ENGLI MED NEIM ORG Dowloaddm OUTHERN MEDICAL UNIVv No other e nal us Copyngnt 2020 M:4 n engl j med nejm.org The new england journal o f medicine 21.0%). However, the exposure history between the two groups of disease severity was similar. Radiologic and Laboratory Findings Table 2 shows the radiologic and laboratory findings on admission. Of 975 CT scans that were performed at the time of admission, 86.2% revealed abnormal results. The most common patterns on chest CT were ground-glass opacity (56.4%) and bilateral patchy shadowing (51.8%). Representative radiologic findings in two patients with nonsevere Covid-19 and in another two patients with severe Covid-19 are provided in Figure S1 in the Supplementary Appendix. No radiographic or CT abnormality was found in 157 of 877 patients (17.9%) with nonsevere disease and in 5 of 173 patients (2.9%) with severe disease. On admission, lymphocytopenia was present in 83.2% of the patients, thrombocytopenia in 36.2%, and leukopenia in 33.7%. Most of the patients had elevated levels of C-reactive protein; less common were elevated levels of alanine aminotransferase, aspartate aminotransferase, Figure 1. Distribution of Patients with Covid-19 across Mainland China. Shown are the official statistics of all documented, laboratory-confirmed cases of coronavirus disease 2019 (Covid-19) throughout China, according to the National Health Commission as of February 4, 2020. The numerator denotes the number of patients who were included in the study cohort and the denominator denotes the number of laboratory-confirmed cases for each province, autonomous region, or provincial municipality, as reported by the National Health Commission. Tibet (0/1) Guangdong (79/683) Fujian (17/170) Taiwan (0/100) Macau (0/8) Hong Kong (0/15) Xinjiang (3/31) Ningxia Qinghai (4/33) (1/10) Gansu (12/51) Shaanxi (15/128) Yunnan (10/113) Guizhou (5/46) Sichuan (33/271) Chongqing (74/300) Guangxi (28/127) Hunan (60/521) Hubei (308/11,177) Henan (78/566) Shandong (29/246) Jiangxi (35/391) Anhui (40/408) Zhejiang (89/724) Jiangsu (37/254) Shanghai (14/193) Heilongjiang (17/109) Jilin (5/24) Liaoning (22/70) Inner Mongolia (6/31) Shanxi (16/66) Hebei (11/118) Tianjin (11/49) Beijing (21/212) Hainan 0 125 250 (19/70) 0 250 500 750 375 500 Miles Km No. of Confirmed Cases 1–9 10–99 100–499 500–999 1,000–11,177 The New England Journal of Medicine Downloaded from nejm.org at SOUTHERN MEDICAL UNIVERSITY on March 6, 2020. For personal use only. No other uses without permission. Copyright © 2020 Massachusetts Medical Society. All rights reserved