正在加载图片...
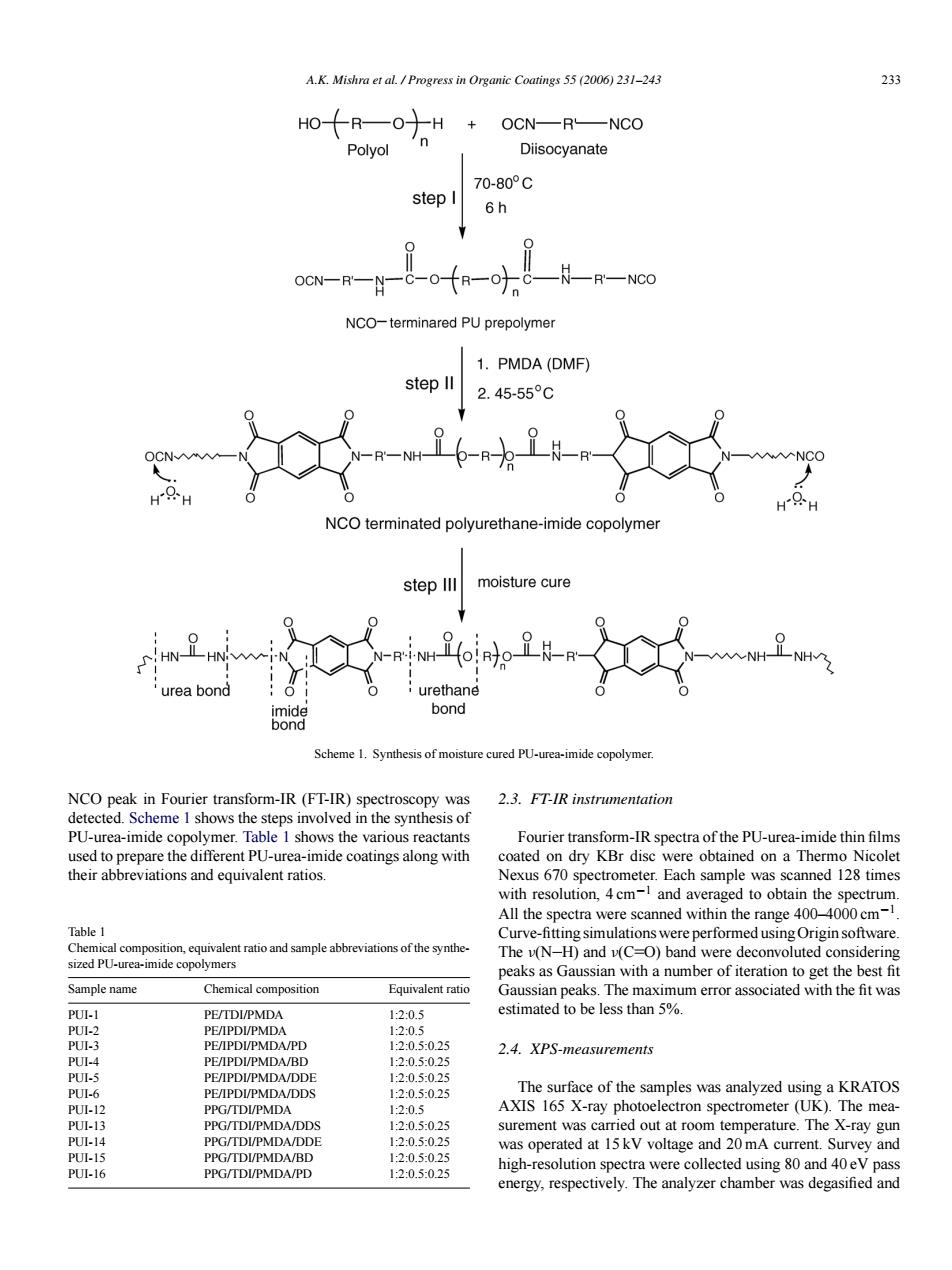
A.K.Misra etal/Progress in Organic Coating5552006231-243 233 + OCN—RL—NCO Polyol Diisocvanate 70-80°c step I 6h ocN-R-N-C-O-叶 NCO-terminared PU prepolymer 1.PMDA (DMF) step ll 2.45-55°℃ NCO terminated polyurethane-imide copolyme step ll moisture cure NH ILNH urea bond :urethane bond Scheme 1.Svnthesis of mo e cured PU- NCO peak in Fourier transform-IR (FT-IR)spectroscopy was 2.3.FT-IR instrumentation Fourier rans m-IR spectra of the PU-urea-imide thin films Nexus 670 s with resolution,4cm-and averaged to obtain the spectrum All the spectra were scanned within the range 400-4000 cm N were pertor eaks as Gaussian with a number of iteration to get the best fit ample name Chemical composition Equivalent ratio Gaussian peaks.The maximum error associated with the fit was PE/TDIPMDA 1205 estimated to be less than 5% -0.25 2.4.XPS-measurements The surface of the samples was analyzed using a KRATOS 20 AXIS 165 X-ray The The mea PPG/TDIPMDA/PD 120.5025 high-resolution spectra were collected using 80 and 40eV pass energy,respectively.The analyzer chamber was degasified andA.K. Mishra et al. / Progress in Organic Coatings 55 (2006) 231–243 233 Scheme 1. Synthesis of moisture cured PU-urea-imide copolymer. NCO peak in Fourier transform-IR (FT-IR) spectroscopy was detected. Scheme 1 shows the steps involved in the synthesis of PU-urea-imide copolymer. Table 1 shows the various reactants used to prepare the different PU-urea-imide coatings along with their abbreviations and equivalent ratios. Table 1 Chemical composition, equivalent ratio and sample abbreviations of the synthesized PU-urea-imide copolymers Sample name Chemical composition Equivalent ratio PUI-1 PE/TDI/PMDA 1:2:0.5 PUI-2 PE/IPDI/PMDA 1:2:0.5 PUI-3 PE/IPDI/PMDA/PD 1:2:0.5:0.25 PUI-4 PE/IPDI/PMDA/BD 1:2:0.5:0.25 PUI-5 PE/IPDI/PMDA/DDE 1:2:0.5:0.25 PUI-6 PE/IPDI/PMDA/DDS 1:2:0.5:0.25 PUI-12 PPG/TDI/PMDA 1:2:0.5 PUI-13 PPG/TDI/PMDA/DDS 1:2:0.5:0.25 PUI-14 PPG/TDI/PMDA/DDE 1:2:0.5:0.25 PUI-15 PPG/TDI/PMDA/BD 1:2:0.5:0.25 PUI-16 PPG/TDI/PMDA/PD 1:2:0.5:0.25 2.3. FT-IR instrumentation Fourier transform-IR spectra of the PU-urea-imide thin films coated on dry KBr disc were obtained on a Thermo Nicolet Nexus 670 spectrometer. Each sample was scanned 128 times with resolution, 4 cm−1 and averaged to obtain the spectrum. All the spectra were scanned within the range 400–4000 cm−1. Curve-fitting simulations were performed using Origin software. The ν(N H) and ν(C O) band were deconvoluted considering peaks as Gaussian with a number of iteration to get the best fit Gaussian peaks. The maximum error associated with the fit was estimated to be less than 5%. 2.4. XPS-measurements The surface of the samples was analyzed using a KRATOS AXIS 165 X-ray photoelectron spectrometer (UK). The measurement was carried out at room temperature. The X-ray gun was operated at 15 kV voltage and 20 mA current. Survey and high-resolution spectra were collected using 80 and 40 eV pass energy, respectively. The analyzer chamber was degasified and