正在加载图片...
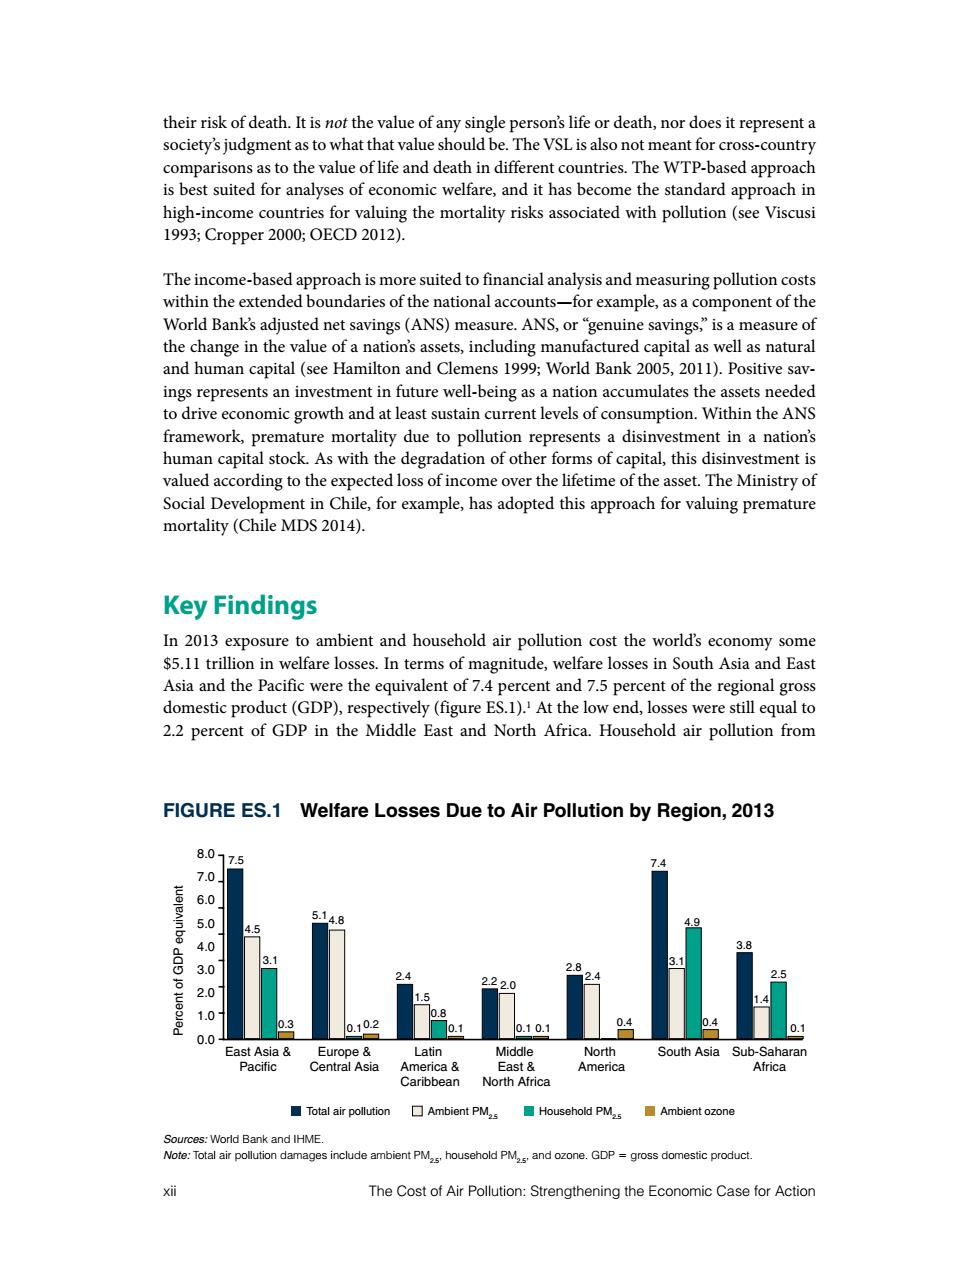
their risk of death.It is not the value of any single person's life or death,nor does it represent a society's judgment as to what that value should be.The VSL is also not meant for cross-country comparisons as to the value of life and death in different countries.The WTP-based approach is best suited for analyses of economic welfare,and it has become the standard approach in high-income countries for valuing the mortality risks associated with pollution(see Viscusi 1993;Cropper 2000;OECD 2012). The income-based approach is more suited to financial analysis and measuring pollution costs within the extended boundaries of the national accounts-for example,as a component of the World Bank's adjusted net savings(ANS)measure.ANS,or"genuine savings,"is a measure of the change in the value of a nation's assets,including manufactured capital as well as natural and human capital(see Hamilton and Clemens 1999;World Bank 2005,2011).Positive sav- ings represents an investment in future well-being as a nation accumulates the assets needed to drive economic growth and at least sustain current levels of consumption.Within the ANS framework,premature mortality due to pollution represents a disinvestment in a nation's human capital stock.As with the degradation of other forms of capital,this disinvestment is valued according to the expected loss of income over the lifetime of the asset.The Ministry of Social Development in Chile,for example,has adopted this approach for valuing premature mortality (Chile MDS 2014). Key Findings In 2013 exposure to ambient and household air pollution cost the world's economy some $5.11 trillion in welfare losses.In terms of magnitude,welfare losses in South Asia and East Asia and the Pacific were the equivalent of 7.4 percent and 7.5 percent of the regional gross domestic product(GDP),respectively(figure ES.1).At the low end,losses were still equal to 2.2 percent of GDP in the Middle East and North Africa.Household air pollution from FIGURE ES.1 Welfare Losses Due to Air Pollution by Region,2013 8.0- 7.5 4 7.0 6.0 5.0 5.148 4.0 3.8 3.1 3.0 2.8 2.4 2.4 2.0 222.0 1.5 1.0 0.8 D.3 0.10.2 0.10.1 0.4 0.1 0 0.0 East Asia Europe Latin Middle North South Asia Sub-Saharan Pacific Central Asia America East America Africa Caribbean North Africa 圆Total air pollution ☐Ambient PM2s Household PM,s Ambient ozone Sources:World Bank and IHME. Note:Total air pollution damages include ambient PM,s,household PM,s,and ozone.GDP=gross domestic product. xii The Cost of Air Pollution:Strengthening the Economic Case for Actionxii The Cost of Air Pollution: Strengthening the Economic Case for Action their risk of death. It is not the value of any single person’s life or death, nor does it represent a society’s judgment as to what that value should be. The VSL is also not meant for cross-country comparisons as to the value of life and death in different countries. The WTP-based approach is best suited for analyses of economic welfare, and it has become the standard approach in high-income countries for valuing the mortality risks associated with pollution (see Viscusi 1993; Cropper 2000; OECD 2012). The income-based approach is more suited to financial analysis and measuring pollution costs within the extended boundaries of the national accounts—for example, as a component of the World Bank’s adjusted net savings (ANS) measure. ANS, or “genuine savings,” is a measure of the change in the value of a nation’s assets, including manufactured capital as well as natural and human capital (see Hamilton and Clemens 1999; World Bank 2005, 2011). Positive savings represents an investment in future well-being as a nation accumulates the assets needed to drive economic growth and at least sustain current levels of consumption. Within the ANS framework, premature mortality due to pollution represents a disinvestment in a nation’s human capital stock. As with the degradation of other forms of capital, this disinvestment is valued according to the expected loss of income over the lifetime of the asset. The Ministry of Social Development in Chile, for example, has adopted this approach for valuing premature mortality (Chile MDS 2014). Key Findings In 2013 exposure to ambient and household air pollution cost the world’s economy some $5.11 trillion in welfare losses. In terms of magnitude, welfare losses in South Asia and East Asia and the Pacific were the equivalent of 7.4 percent and 7.5 percent of the regional gross domestic product (GDP), respectively (figure ES.1).1 At the low end, losses were still equal to 2.2 percent of GDP in the Middle East and North Africa. Household air pollution from Figure ES.1 Welfare Losses Due to Air Pollution by Region, 2013 Percent of GDP equivalent East Asia & Pacific Europe & Central Asia Latin America & Caribbean Middle East & North Africa North America South Asia Sub-Saharan Africa 8.0 7.0 6.0 5.0 4.0 3.0 2.0 1.0 0.0 7.5 4.5 3.1 0.3 5.14.8 0.10.2 2.4 1.5 0.8 0.1 2.2 2.0 0.1 0.1 2.8 2.4 0.4 7.4 3.1 4.9 0.4 3.8 1.4 2.5 0.1 Total air pollution Ambient PM2.5 Household PM2.5 Ambient ozone Sources: World Bank and IHME. Note: Total air pollution damages include ambient PM2.5, household PM2.5, and ozone. GDP 5 gross domestic product. 1700234_Cost of Pollution.indd 12 8/29/16 2:51 PM