正在加载图片...
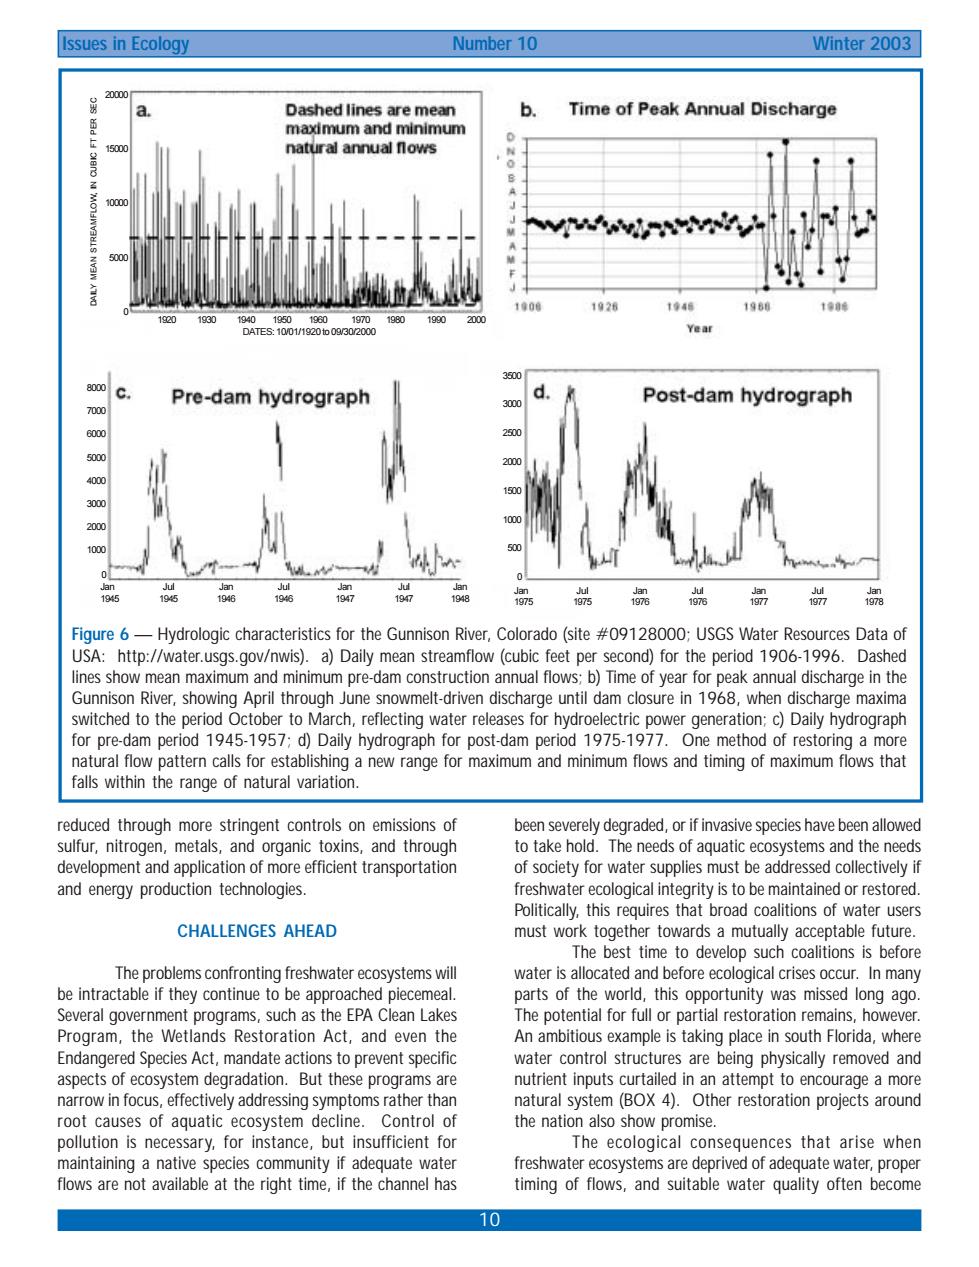
Issues in Ecology Number 10 Winter 2003 Time of Peak Annual Discharge natural annual nows 000 Pre-dam hydrograph d Post-dam hydrograph 0a 00 Figure6-Hydrologic characteristics for the Gunnison River,Colorado(site #09128000:USGS Water Resources Data of USA:http://water.usgs.gov/nwis).a)Daily mean streamflow (cubic feet per second)for the period 1906-1996.Dashed lines show mean maximum and minimum pre-dam construction annual flows:b)Time of year for peak annual discharge in the Gunnison River,showing April through June snowmelt-driven discharge until dam closure in 1968,when discharge maxima switched to the period October to March,reflecting water releases for hydroelectric power generation:c)Daily hydrograph for pre-dam period 1945-1957:d)Daily hydrograph for post-dam period 1975-1977.One method of restoring a more natural flow pattern calls for establishing a new range for maximum and minimum flows and timing of maximum flows that falls within the range of natural variation. reduced through more stringent controls on emissions of been severely degraded,or if invasive species have been allowe sulfur,nitrogen,metals,and organic toxins,and through to take hold.The needs of aquatic ecosystems and the needs development and application of more efficient transportation of society for water supplies must be addressed collectively i and energy production technologies. freshwater ecological integrity is to be maintained or restored Politically,this requires that broad coalitions of water users CHALLENGES AHEAD must work togetne to dev efor water i ld.this oppo ity was misse ong ag uch e EPA C and Enda e Species Act da o prevent specifi n ut the ral system (BOX 4).Other root causes of the nation also show p pollution is necessary.for instance.but insufficient for The ecological consequences that arise when maintaining a native species community if adequate water flows are not available at the right time,if the channel has 1010 Issues in Ecology Number 10 Winter 2003 Figure 6 — Hydrologic characteristics for the Gunnison River, Colorado (site #09128000; USGS Water Resources Data of USA: http://water.usgs.gov/nwis). a) Daily mean streamflow (cubic feet per second) for the period 1906-1996. Dashed lines show mean maximum and minimum pre-dam construction annual flows; b) Time of year for peak annual discharge in the Gunnison River, showing April through June snowmelt-driven discharge until dam closure in 1968, when discharge maxima switched to the period October to March, reflecting water releases for hydroelectric power generation; c) Daily hydrograph for pre-dam period 1945-1957; d) Daily hydrograph for post-dam period 1975-1977. One method of restoring a more natural flow pattern calls for establishing a new range for maximum and minimum flows and timing of maximum flows that falls within the range of natural variation. reduced through more stringent controls on emissions of sulfur, nitrogen, metals, and organic toxins, and through development and application of more efficient transportation and energy production technologies. CHALLENGES AHEAD The problems confronting freshwater ecosystems will be intractable if they continue to be approached piecemeal. Several government programs, such as the EPA Clean Lakes Program, the Wetlands Restoration Act, and even the Endangered Species Act, mandate actions to prevent specific aspects of ecosystem degradation. But these programs are narrow in focus, effectively addressing symptoms rather than root causes of aquatic ecosystem decline. Control of pollution is necessary, for instance, but insufficient for maintaining a native species community if adequate water flows are not available at the right time, if the channel has been severely degraded, or if invasive species have been allowed to take hold. The needs of aquatic ecosystems and the needs of society for water supplies must be addressed collectively if freshwater ecological integrity is to be maintained or restored. Politically, this requires that broad coalitions of water users must work together towards a mutually acceptable future. The best time to develop such coalitions is before water is allocated and before ecological crises occur. In many parts of the world, this opportunity was missed long ago. The potential for full or partial restoration remains, however. An ambitious example is taking place in south Florida, where water control structures are being physically removed and nutrient inputs curtailed in an attempt to encourage a more natural system (BOX 4). Other restoration projects around the nation also show promise. The ecological consequences that arise when freshwater ecosystems are deprived of adequate water, proper timing of flows, and suitable water quality often become 8000 7000 6000 5000 4000 3000 2000 1000 0 Jan Jul Jan Jul Jan Jul Jan 1945 1945 1946 1946 1947 1947 1948 3500 3000 2500 2000 1500 1000 500 0 Jan Jul Jan Jul Jan Jul Jan 1975 1975 1976 1976 1977 1977 1978 1920 1930 1940 1950 1960 1970 1980 1990 2000 DATES: 10/01/1920 to 09/30/2000 20000 15000 10000 5000 0 DAILY MEAN STREAMFLOW, IN CUBIC FT PER SEC