正在加载图片...
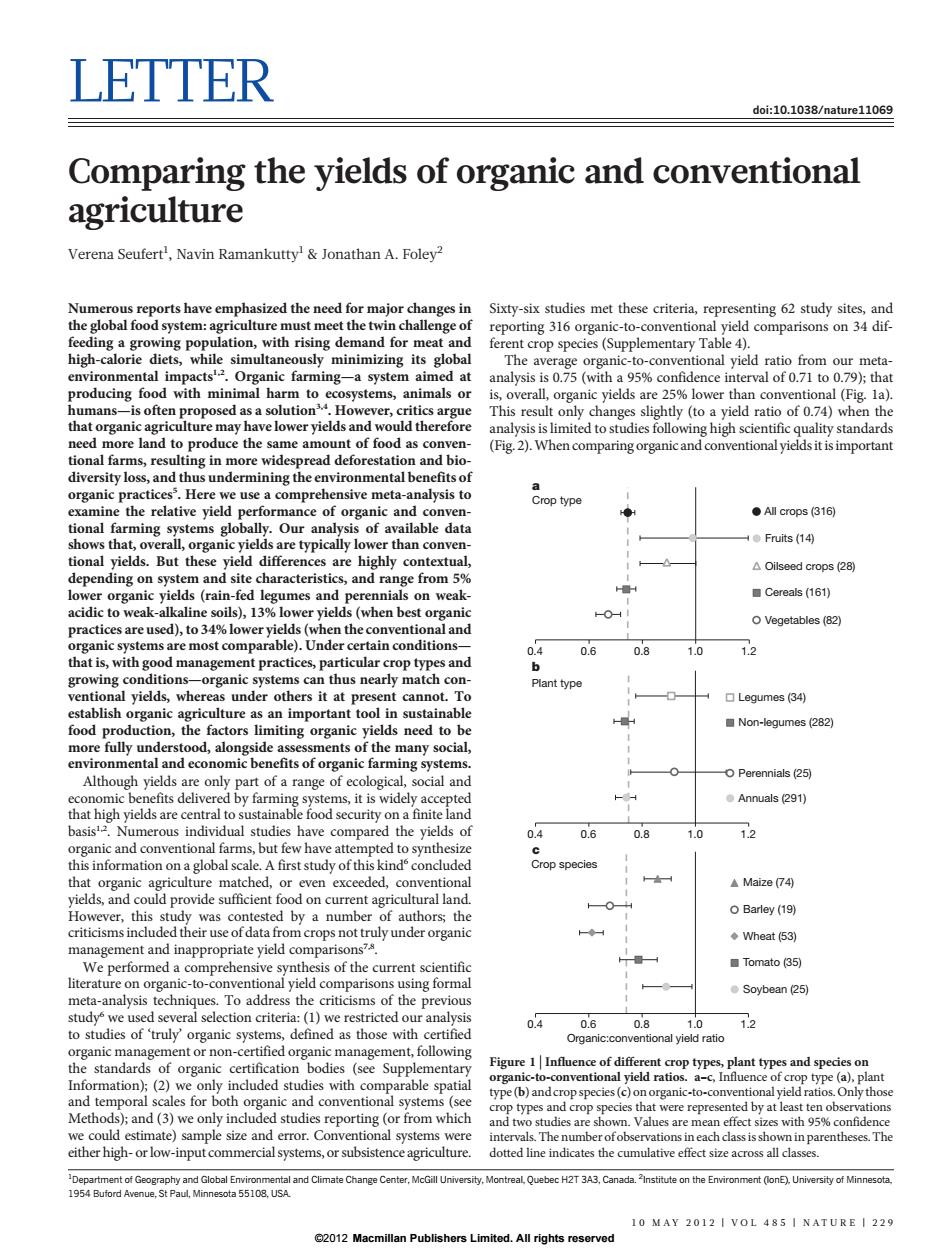
LETTER doi:10.1038/nature:11069 Comparing the yields of organic and conventional agriculture Verena Seufert,Navin Ramankutty Jonathan A.Foley2 Numerous reports have emphasized the need for major changes in Sixty-six studies met these criteria,representing 62 study sites,and the global food system:agriculture must meet the twin challenge of reporting 316 organic-to-conventional yield comparisons on 34 dif- feeding a growing population,with rising demand for meat and ferent crop species (Supplementary Table 4). high-calorie diets,while simultaneously minimizing its global The average organic-to-conventional yield ratio from our meta- environmental impacts'.Organic farming-a system aimed at analysis is 0.75 (with a 95%confidence interval of 0.71 to 0.79);that producing food with minimal harm to ecosystems,animals or is,overall,organic yields are 25%lower than conventional (Fig.la). humans-is often proposed as a solution.However,critics argue This result only changes slightly (to a yield ratio of 0.74)when the that organic agriculture may have lower yields and would therefore analysis is limited to studies following high scientific quality standards need more land to produce the same amount of food as conven- (Fig.2).When comparing organic and conventionalyields it is important tional farms,resulting in more widespread deforestation and bio- diversity loss,and thus undermining the environmental benefits of a organic practices Here we use a comprehensive meta-analysis to Crop type examine the relative yield performance of organic and conven- ●All crops(316) tional farming systems globally.Our analysis of available data shows that,overall,organic yields are typically lower than conven- ●Fruits(14) tional yields.But these yield differences are highly contextual, △Oilseed crops(28) depending on system and site characteristics,and range from 5% lower organic yields(rain-fed legumes and perennials on weak- ■Cereals(161) acidic to weak-alkaline soils),13%lower yields(when best organic O Vegetables (82) practices are used),to 34%lower yields(when the conventional and organic systems are most comparable).Under certain conditions- 0.4 0.6 0.8 1.0 1.2 that is,with good management practices,particular crop types and b growing conditions-organic systems can thus nearly match con- Plant type ventional yields,whereas under others it at present cannot.To ▣Legumes(34 establish organic agriculture as an important tool in sustainable food production,the factors limiting organic yields need to be ■Non-legumes(282) more fully understood,alongside assessments of the many social, environmental and economic benefits of organic farming systems. Although yields are only part of a range of ecological,social and -O Perennials(25) economic benefits delivered by farming systems,it is widely accepted ●Annuals291) that high yields are central to sustainable food security on a finite land basis2.Numerous individual studies have compared the yields of 0.4 0.6 0.8 1.0 1.2 organic and conventional farms,but few have attempted to synthesize this information on a global scale.A first study of this kind concluded Crop species that organic agriculture matched,or even exceeded,conventional ▲Maize74④ yields,and could provide sufficient food on current agricultural land. However,this study was contested by a number of authors;the O Barley (19) criticisms included their use of data from crops not truly under organic ◆Wheat(53) management and inappropriate yield comparisons?*. We performed a comprehensive synthesis of the current scientific ■Tomato35) literature on organic-to-conventional yield comparisons using formal ●Soybean25) meta-analysis techniques.To address the criticisms of the previous study we used several selection criteria:(1)we restricted our analysis 0.4 0.6 0.81.0 1.2 to studies of 'truly'organic systems,defined as those with certified Organic:conventional yield ratio organic management or non-certified organic management,following the standards of organic certification bodies (see Supplementary Figure 1|Influence of different crop types,plant types and species on Information);(2)we only included studies with comparable spatial organic-to-conventional yield ratios.a-c,Influence of crop type(a),plant and temporal scales for both organic and conventional systems(see type(b)andcropspecies(c)onorganic-to-conventional yield ratios.Only those crop types and crop species that were represented by at least ten observations Methods);and(3)we only included studies reporting(or from which and two studies are shown.Values are mean effect sizes with 95%confidence we could estimate)sample size and error.Conventional systems were intervals.The number ofobservations in each class is shown in parentheses.The either high-or low-input commercial systems,or subsistence agriculture. dotted line indicates the cumulative effect size across all classes. Department of Geography and Global Environmental and Climate Change Center,McGill University,Montreal Quebec H2T 3A3,Canada.2Institute on the Environment(onE).University of Minnesota. 1954 Buford Avenue,St Paul,Minnesota 55108,USA 10 MAY 2012 VOL 485 NATURE 229 2012 Macmillan Publishers Limited.All rights reservedLETTER doi:10.1038/nature11069 Comparing the yields of organic and conventional agriculture Verena Seufert1 , Navin Ramankutty1 & Jonathan A. Foley2 Numerous reports have emphasized the need for major changes in the global food system: agriculture must meet the twin challenge of feeding a growing population, with rising demand for meat and high-calorie diets, while simultaneously minimizing its global environmental impacts1,2. Organic farming—a system aimed at producing food with minimal harm to ecosystems, animals or humans—is often proposed as a solution3,4. However, critics argue that organic agriculture may have lower yields and would therefore need more land to produce the same amount of food as conventional farms, resulting in more widespread deforestation and biodiversity loss, and thus undermining the environmental benefits of organic practices5 . Here we use a comprehensive meta-analysis to examine the relative yield performance of organic and conventional farming systems globally. Our analysis of available data shows that, overall, organic yields are typically lower than conventional yields. But these yield differences are highly contextual, depending on system and site characteristics, and range from 5% lower organic yields (rain-fed legumes and perennials on weakacidic to weak-alkaline soils), 13% lower yields (when best organic practices are used), to 34% lower yields (when the conventional and organic systems are most comparable). Under certain conditions— that is, with good management practices, particular crop types and growing conditions—organic systems can thus nearly match conventional yields, whereas under others it at present cannot. To establish organic agriculture as an important tool in sustainable food production, the factors limiting organic yields need to be more fully understood, alongside assessments of the many social, environmental and economic benefits of organic farming systems. Although yields are only part of a range of ecological, social and economic benefits delivered by farming systems, it is widely accepted that high yields are central to sustainable food security on a finite land basis1,2. Numerous individual studies have compared the yields of organic and conventional farms, but few have attempted to synthesize this information on a global scale. A first study of this kind6 concluded that organic agriculture matched, or even exceeded, conventional yields, and could provide sufficient food on current agricultural land. However, this study was contested by a number of authors; the criticisms included their use of data from crops not truly under organic management and inappropriate yield comparisons7,8. We performed a comprehensive synthesis of the current scientific literature on organic-to-conventional yield comparisons using formal meta-analysis techniques. To address the criticisms of the previous study6 we used several selection criteria: (1) we restricted our analysis to studies of ‘truly’ organic systems, defined as those with certified organic management or non-certified organic management, following the standards of organic certification bodies (see Supplementary Information); (2) we only included studies with comparable spatial and temporal scales for both organic and conventional systems (see Methods); and (3) we only included studies reporting (or from which we could estimate) sample size and error. Conventional systems were either high- or low-input commercial systems, or subsistence agriculture. Sixty-six studies met these criteria, representing 62 study sites, and reporting 316 organic-to-conventional yield comparisons on 34 different crop species (Supplementary Table 4). The average organic-to-conventional yield ratio from our metaanalysis is 0.75 (with a 95% confidence interval of 0.71 to 0.79); that is, overall, organic yields are 25% lower than conventional (Fig. 1a). This result only changes slightly (to a yield ratio of 0.74) when the analysis is limited to studies following high scientific quality standards (Fig. 2).When comparing organic and conventional yields it is important 1 Department of Geography and Global Environmental and Climate Change Center, McGill University, Montreal, Quebec H2T 3A3, Canada. 2 Institute on the Environment (IonE), University of Minnesota, 1954 Buford Avenue, St Paul, Minnesota 55108, USA. 0.4 0.6 0.8 1.0 1.2 Crop type All crops (316) Fruits (14) Oilseed crops (28) Cereals (161) Vegetables (82) a 0.4 0.6 0.8 1.0 1.2 Plant type Legumes (34) Non-legumes (282) Perennials (25) Annuals (291) b 0.4 0.6 0.8 1.0 1.2 Organic:conventional yield ratio Crop species Maize (74) Barley (19) Wheat (53) Tomato (35) Soybean (25) c Figure 1 | Influence of different crop types, plant types and species on organic-to-conventional yield ratios. a–c, Influence of crop type (a), plant type (b) and crop species (c) on organic-to-conventional yield ratios. Only those crop types and crop species that were represented by at least ten observations and two studies are shown. Values are mean effect sizes with 95% confidence intervals. The number of observations in each class is shown in parentheses. The dotted line indicates the cumulative effect size across all classes. 10 MAY 2012 | VOL 485 | NATURE | 2 29 ©2012 Macmillan Publishers Limited. All rights reserved