正在加载图片...
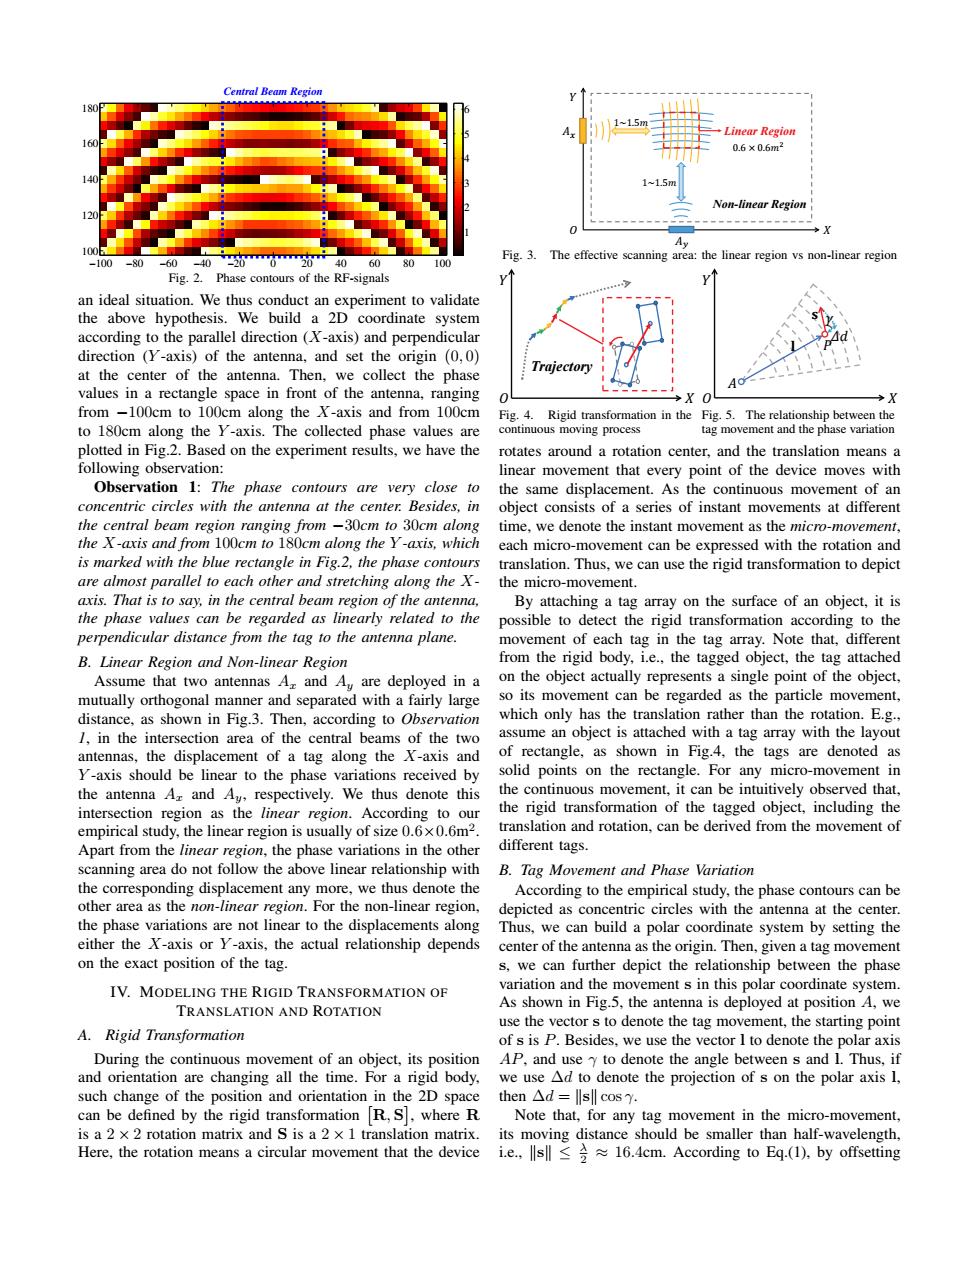
Central Beam Region Linear Region 0.6×0.6m 11.5 Non-linear Region X Ay Fig.3.The effective scanning area:the linear region vs non-linear region -100 -60 -40 04060 80 100 Fig.2.Phase contours of the RF-signals an ideal situation.We thus conduct an experiment to validate the above hypothesis.We build a 2D coordinate system according to the parallel direction (X-axis)and perpendicular direction (Y-axis)of the antenna,and set the origin (0,0) at the center of the antenna.Then,we collect the phase values in a rectangle space in front of the antenna,ranging 0 X O →X from -100cm to 100cm along the X-axis and from 100cm Fig.4.Rigid transformation in the Fig.5.The relationship between the to 180cm along the Y-axis.The collected phase values are continuous moving process tag movement and the phase variation plotted in Fig.2.Based on the experiment results,we have the rotates around a rotation center,and the translation means a following observation: linear movement that every point of the device moves with Observation 1:The phase contours are very close to the same displacement.As the continuous movement of an concentric circles with the antenna at the center.Besides,in object consists of a series of instant movements at different the central beam region ranging from -30cm to 30cm along time,we denote the instant movement as the micro-movement, the X-axis and from 100cm to 180cm along the Y-axis,which each micro-movement can be expressed with the rotation and is marked with the blue rectangle in Fig.2,the phase contours translation.Thus,we can use the rigid transformation to depict are almost parallel to each other and stretching along the X- the micro-movement. axis.That is to say,in the central beam region of the antenna, By attaching a tag array on the surface of an object,it is the phase values can be regarded as linearly related to the possible to detect the rigid transformation according to the perpendicular distance from the tag to the antenna plane. movement of each tag in the tag array.Note that,different B.Linear Region and Non-linear Region from the rigid body,ie..the tagged object,the tag attached Assume that two antennas A and Au are deployed in a on the object actually represents a single point of the object, mutually orthogonal manner and separated with a fairly large so its movement can be regarded as the particle movement, distance,as shown in Fig.3.Then,according to Observation which only has the translation rather than the rotation.E.g., /in the intersection area of the central beams of the two assume an object is attached with a tag array with the layout antennas,the displacement of a tag along the X-axis and of rectangle,as shown in Fig.4,the tags are denoted as Y-axis should be linear to the phase variations received by solid points on the rectangle.For any micro-movement in the antenna Ar and Ay,respectively.We thus denote this the continuous movement,it can be intuitively observed that, intersection region as the linear region.According to our the rigid transformation of the tagged object,including the empirical study,the linear region is usually of size 0.6x0.6m2. translation and rotation,can be derived from the movement of Apart from the linear region,the phase variations in the other different tags scanning area do not follow the above linear relationship with B.Tag Movement and Phase Variation the corresponding displacement any more,we thus denote the According to the empirical study,the phase contours can be other area as the non-linear region.For the non-linear region, depicted as concentric circles with the antenna at the center. the phase variations are not linear to the displacements along Thus,we can build a polar coordinate system by setting the either the X-axis or Y-axis,the actual relationship depends center of the antenna as the origin.Then,given a tag movement on the exact position of the tag. s,we can further depict the relationship between the phase IV.MODELING THE RIGID TRANSFORMATION OF variation and the movement s in this polar coordinate system As shown in Fig.5,the antenna is deployed at position A,we TRANSLATION AND ROTATION use the vector s to denote the tag movement,the starting point A.Rigid Transformation of s is P.Besides,we use the vector I to denote the polar axis During the continuous movement of an object,its position AP,and use y to denote the angle between s and 1.Thus,if and orientation are changing all the time.For a rigid body, we use Ad to denote the projection of s on the polar axis 1, such change of the position and orientation in the 2D space then△d=Isll cos?. can be defined by the rigid transformation R,S,where R Note that,for any tag movement in the micro-movement, is a 2 x 2 rotation matrix and S is a 2 x 1 translation matrix. its moving distance should be smaller than half-wavelength, Here,the rotation means a circular movement that the device i.e.,lsll≤≥≈l6.4cm.According to Eq.(1,by offsetting−100 −80 −60 −40 −20 0 20 40 60 80 100 100 120 140 160 180 1 2 3 4 5 6 Central Beam Region Fig. 2. Phase contours of the RF-signals an ideal situation. We thus conduct an experiment to validate the above hypothesis. We build a 2D coordinate system according to the parallel direction (X-axis) and perpendicular direction (Y -axis) of the antenna, and set the origin (0, 0) at the center of the antenna. Then, we collect the phase values in a rectangle space in front of the antenna, ranging from −100cm to 100cm along the X-axis and from 100cm to 180cm along the Y -axis. The collected phase values are plotted in Fig.2. Based on the experiment results, we have the following observation: Observation 1: The phase contours are very close to concentric circles with the antenna at the center. Besides, in the central beam region ranging from −30cm to 30cm along the X-axis and from 100cm to 180cm along the Y -axis, which is marked with the blue rectangle in Fig.2, the phase contours are almost parallel to each other and stretching along the Xaxis. That is to say, in the central beam region of the antenna, the phase values can be regarded as linearly related to the perpendicular distance from the tag to the antenna plane. B. Linear Region and Non-linear Region Assume that two antennas Ax and Ay are deployed in a mutually orthogonal manner and separated with a fairly large distance, as shown in Fig.3. Then, according to Observation 1, in the intersection area of the central beams of the two antennas, the displacement of a tag along the X-axis and Y -axis should be linear to the phase variations received by the antenna Ax and Ay, respectively. We thus denote this intersection region as the linear region. According to our empirical study, the linear region is usually of size 0.6×0.6m2 . Apart from the linear region, the phase variations in the other scanning area do not follow the above linear relationship with the corresponding displacement any more, we thus denote the other area as the non-linear region. For the non-linear region, the phase variations are not linear to the displacements along either the X-axis or Y -axis, the actual relationship depends on the exact position of the tag. IV. MODELING THE RIGID TRANSFORMATION OF TRANSLATION AND ROTATION A. Rigid Transformation During the continuous movement of an object, its position and orientation are changing all the time. For a rigid body, such change of the position and orientation in the 2D space can be defined by the rigid transformation R, S , where R is a 2 × 2 rotation matrix and S is a 2 × 1 translation matrix. Here, the rotation means a circular movement that the device ܺ ܻ ܣ௫ Linear Region 1~1.ͷ݉ 1~1.ͷ݉ 0.6 × 0.6݉ଶ Non-linear Region ௬ܣ ܱ Fig. 3. The effective scanning area: the linear region vs non-linear region ܺ ܻ Trajectory ܱ ܣ ܲ ܛ ܔ ߛ ݀߂ ܺ ܻ ܱ Fig. 4. Rigid transformation in the continuous moving process ܺ ܻ ܣ ܲ ܛ ܔ ߛ ݀߂ ܱ ܣ ܲ ܛ ܔ ߛ ݀߂ ܺ ܻ ܱ Fig. 5. The relationship between the tag movement and the phase variation rotates around a rotation center, and the translation means a linear movement that every point of the device moves with the same displacement. As the continuous movement of an object consists of a series of instant movements at different time, we denote the instant movement as the micro-movement, each micro-movement can be expressed with the rotation and translation. Thus, we can use the rigid transformation to depict the micro-movement. By attaching a tag array on the surface of an object, it is possible to detect the rigid transformation according to the movement of each tag in the tag array. Note that, different from the rigid body, i.e., the tagged object, the tag attached on the object actually represents a single point of the object, so its movement can be regarded as the particle movement, which only has the translation rather than the rotation. E.g., assume an object is attached with a tag array with the layout of rectangle, as shown in Fig.4, the tags are denoted as solid points on the rectangle. For any micro-movement in the continuous movement, it can be intuitively observed that, the rigid transformation of the tagged object, including the translation and rotation, can be derived from the movement of different tags. B. Tag Movement and Phase Variation According to the empirical study, the phase contours can be depicted as concentric circles with the antenna at the center. Thus, we can build a polar coordinate system by setting the center of the antenna as the origin. Then, given a tag movement s, we can further depict the relationship between the phase variation and the movement s in this polar coordinate system. As shown in Fig.5, the antenna is deployed at position A, we use the vector s to denote the tag movement, the starting point of s is P. Besides, we use the vector l to denote the polar axis AP, and use γ to denote the angle between s and l. Thus, if we use ∆d to denote the projection of s on the polar axis l, then ∆d = ksk cos γ. Note that, for any tag movement in the micro-movement, its moving distance should be smaller than half-wavelength, i.e., ksk ≤ λ 2 ≈ 16.4cm. According to Eq.(1), by offsetting��