正在加载图片...

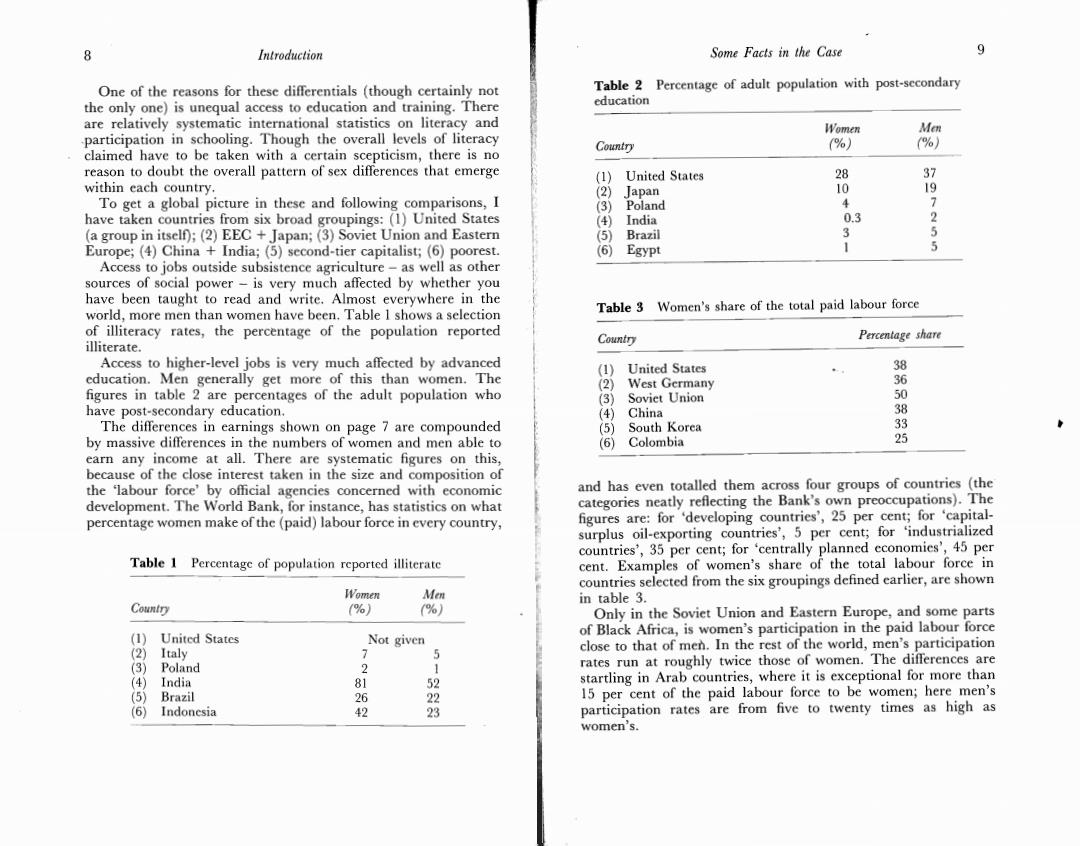
8 Introduction Some Facts in the Case 9 One of the reasons for these differentials (though certainly not Table 2 Percentage of adult population with post-secondary the only one)is unequal access to education and training.There education are relatively systematic international statistics on literacy and Women Men participation in schooling.Though the overall levels of literacy Country %) (%) claimed have to be taken with a certain scepticism,there is no reason to doubt the overall pattern of sex differences that emerge (1) United States 28 37 within each country. (2) apan 10 1 To get a global picture in these and following comparisons,I (3) Poland 7 have taken countries from six broad groupings:(1)United States (4) India 0.3 (a group in itself);(2)EEC Japan;(3)Soviet Union and Eastern (5) Brazil 5 Europe;(4)China India;(5)second-tier capitalist;(6)poorest. (6) Egypt 5 Access to jobs outside subsistence agriculture-as well as other sources of social power-is very much affected by whether you have been taught to read and write.Almost everywhere in the world,more men than women have been.Table I shows a selection Table 3 Women's share of the total paid labour force of illiteracy rates,the percentage of the population reported Percentage share illiterate. Country Access to higher-level jobs is very much affected by advanced (1) United States 38 education.Men generally get more of this than women.The figures in table 2 are percentages of the adult population who West Germany 36 (3) Soviet Union 0 have post-secondary education. (4) China 8 The differences in earnings shown on page 7 are compounded (5) South Korea 33 by massive differences in the numbers of women and men able to (6) Colombia 5 earn any income at all.There are systematic figures on this, because of the close interest taken in the size and composition of the 'labour force'by official agencies concerned with economic and has even totalled them across four groups of countries (the development.The World Bank,for instance,has statistics on what categories neatly reflecting the Bank's own preoccupations).The percentage women make of the(paid)labour force in every country, figures are:for 'developing countries',25 per cent;for 'capital- surplus oil-exporting countries',5 per cent;for 'industrialized countries',35 per cent;for 'centrally planned economies',45 per Table 1 Percentage of population reported illiterate cent.Examples of women's share of the total labour force in countries selected from the six groupings defined earlier,are shown Women Men in table 3. Country (%) %) Only in the Soviet Union and Eastern Europe,and some parts (1) United States Not given of Black Africa,is women's participation in the paid labour force (2) Italy 》 5 close to that of men.In the rest of the world,men's participation (3) Poland 2 1 rates run at roughly twice those of women.The differences are (4) India 81 5 startling in Arab countries,where it is exceptional for more than (5) Brazil 26 22 15 per cent of the paid labour force to be women;here men's (6) Indonesia 42 3 participation rates are from five to twenty times as high as women's