正在加载图片...
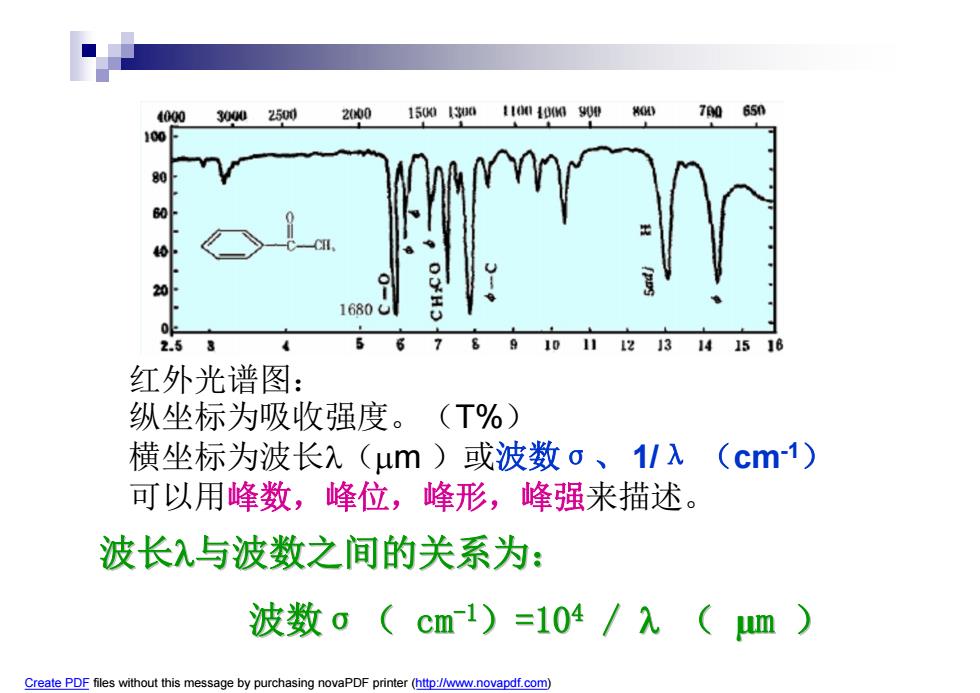
4000300025002000 15001300【101100900400 70650 100 2 2.5 10 11 12 13 14 15 红外光谱图: 纵坐标为吸收强度。(T%) 横坐标为波长)(μm)或波数o、1/入 (cm-1) 可以用峰数,峰位,峰形,峰强来描述。 波长λ与波数之间的关系为: 波数o(cm1)=104/入(m) Create PDF files without this message by purchasing novaPDF printer(http://www.novapdf.com) 红外光谱图: 纵坐标为吸收强度。(T%) 横坐标为波长(m )或波数σ、 1/λ (cm-1) 可以用峰数,峰位,峰形,峰强来描述。 波长与波数之间的关系为: 波数σ( cm-1)=104 / ( µm ) Create PDF files without this message by purchasing novaPDF printer (http://www.novapdf.com)