正在加载图片...
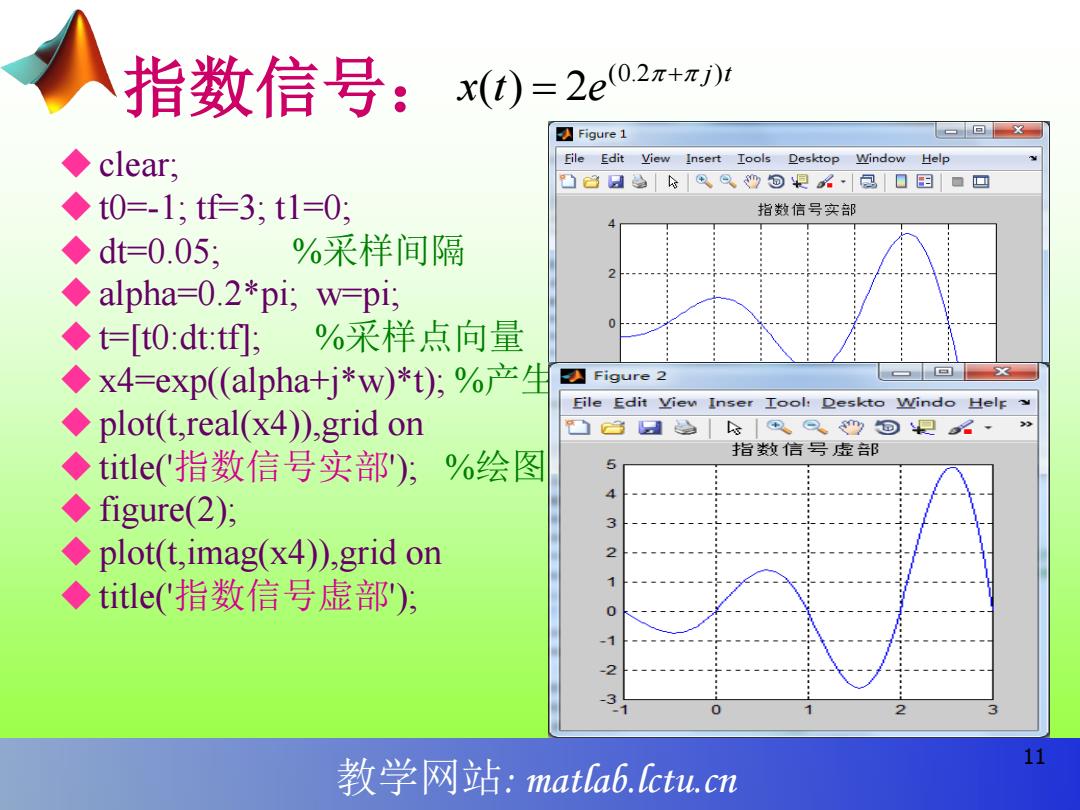
指数信号:x(0)=2eo2+4 ☑Figure1 ▣回X ◆clear; File Edit View Insert Iools Desktop Window Help 面3日®⊙业回根%·包■用■四 ◆t0=-1;tf=3;t1=0; 指数信号实部 ◆dt=0.05; %采样间隔 ◆alpha=0.2*pi,w=pi ◆=[t0:dt:tf;%采样点向量 ◆x4=exp(alpha+j*w)*t),%产生 Figure 2 Eile Edit View Inser Iool:Deskto Windo Help plot(t,real(x4)),grid on 指数信号虚部 ◆title((指数信号实部);%绘图 5 ◆figure(2): 3 plot(t,imag(x4)),grid on 2 ◆title('指数信号虚部): 11 教学网站:mata6.lctu.cn教学网站: matlab.lctu.cn 指数信号: clear; t0=-1; tf=3; t1=0; dt=0.05; %采样间隔 alpha=0.2*pi; w=pi; t=[t0:dt:tf]; %采样点向量 x4=exp((alpha+j*w)*t); %产生指数信号 plot(t,real(x4)),grid on title('指数信号实部'); %绘图 figure(2); plot(t,imag(x4)),grid on title('指数信号虚部'); (0.2 ) ( ) 2 j t x t e 11