正在加载图片...
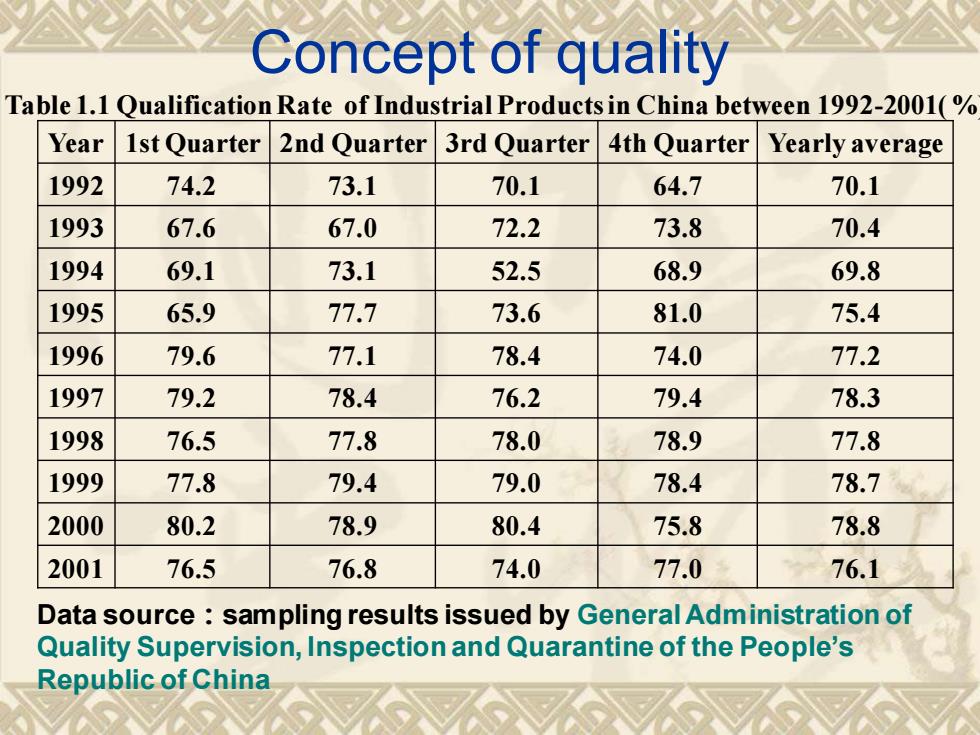
Concept of quality Table 1.1 Qualification Rate of Industrial Products in China between 1992-2001(% Year 1st Quarter 2nd Quarter 3rd Quarter 4th Quarter Yearly average 1992 74.2 73.1 70.1 64.7 70.1 1993 67.6 67.0 72.2 73.8 70.4 1994 69.1 73.1 52.5 68.9 69.8 1995 65.9 77.7 73.6 81.0 75.4 1996 79.6 77.1 78.4 74.0 77.2 1997 79.2 78.4 76.2 79.4 78.3 1998 76.5 77.8 78.0 78.9 77.8 1999 77.8 79.4 79.0 78.4 78.7 2000 80.2 78.9 80.4 75.8 78.8 2001 76.5 76.8 74.0 77.0 76.1 Data source sampling results issued by General Administration of Quality Supervision,Inspection and Quarantine of the People's Republic of China Concept of quality Table 1.1 Qualification Rate of Industrial Products in China between 1992-2001( %) Year 1st Quarter 2nd Quarter 3rd Quarter 4th Quarter Yearly average 1992 74.2 73.1 70.1 64.7 70.1 1993 67.6 67.0 72.2 73.8 70.4 1994 69.1 73.1 52.5 68.9 69.8 1995 65.9 77.7 73.6 81.0 75.4 1996 79.6 77.1 78.4 74.0 77.2 1997 79.2 78.4 76.2 79.4 78.3 1998 76.5 77.8 78.0 78.9 77.8 1999 77.8 79.4 79.0 78.4 78.7 2000 80.2 78.9 80.4 75.8 78.8 2001 76.5 76.8 74.0 77.0 76.1 Data source:sampling results issued by General Administration of Quality Supervision, Inspection and Quarantine of the People’s Republic of China