正在加载图片...
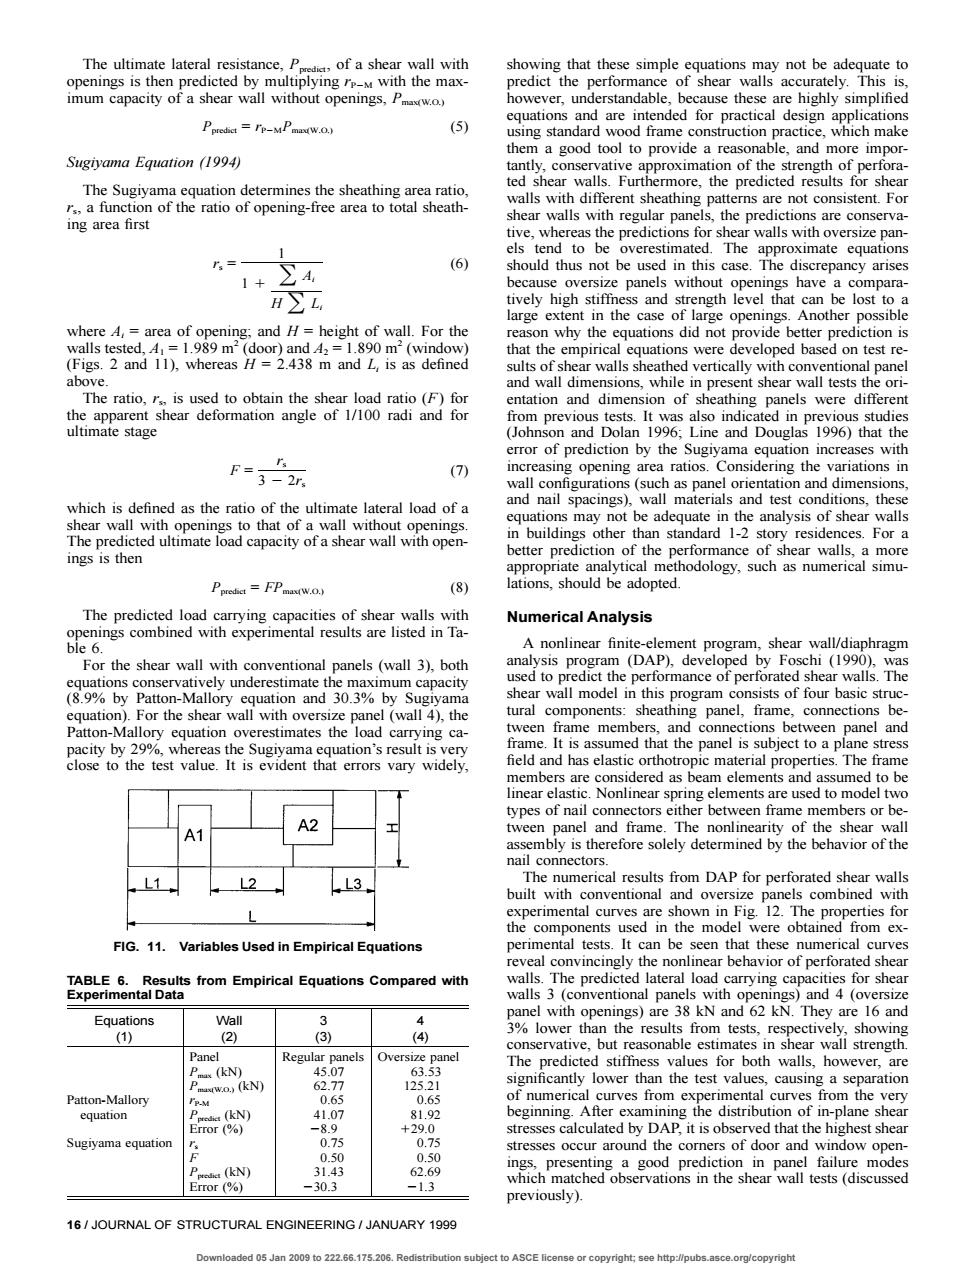
showing that these ot be imum capacity of a shear wall without openings.P =-MPw Sugivama Equation (1994) m a good ing area first n 1+ (6) because oversize panels without op have a c H∑L 三 )that th F-3m corol which is defined as the ratio of the ultimate lateral load of a and nail s.whaalernlsoridtationanddime f she ings is then better pr (8) Numerical Analysis ragm For the shear wall with panels(wall 3).both ance of perl ar wal 89 del in this of fou tural g panel,fram Patton-Ma connectio umd that the panelis biect to A2 L1 2L3. n DaP for built with conventional 1 obtained from x FIG.11.Variables Used in Empirical Equations then be are 16 and t31 4 but Regula ive, (kN) 07 The (kN ificantly lower than the test values causing a sepa ation Patton-Mallory ne highest shea 303 13 previously) 16/JOURNAL OF STRUCTURAL ENGINEERING/JANUARY 1999 ed 05 Jan 2009 to 222.65.175.206.Redistrib o ASCE lic right:soo http:/pubs.asco.org/copyright 16 / JOURNAL OF STRUCTURAL ENGINEERING / JANUARY 1999 TABLE 6. Results from Empirical Equations Compared with Experimental Data Equations (1) Wall (2) 3 (3) 4 (4) Panel Regular panels Oversize panel Pmax (kN) 45.07 63.53 Pmax(W.O.) (kN) 62.77 125.21 Patton-Mallory equation rP-M Ppredict (kN) Error (%) 0.65 41.07 28.9 0.65 81.92 129.0 Sugiyama equation rs F Ppredict (kN) Error (%) 0.75 0.50 31.43 230.3 0.75 0.50 62.69 21.3 FIG. 11. Variables Used in Empirical Equations The ultimate lateral resistance, Ppredict, of a shear wall with openings is then predicted by multiplying rP2M with the maximum capacity of a shear wall without openings, Pmax(W.O.) Ppredict P = r P 2M max(W.O.) (5) Sugiyama Equation (1994) The Sugiyama equation determines the sheathing area ratio, rs, a function of the ratio of opening-free area to total sheathing area first 1 rs = (6) O Ai 1 1 H L O i where Ai = area of opening; and H = height of wall. For the walls tested, A1 = 1.989 m2 (door) and A2 = 1.890 m2 (window) (Figs. 2 and 11), whereas H = 2.438 m and Li is as defined above. The ratio, rs, is used to obtain the shear load ratio (F) for the apparent shear deformation angle of 1/100 radi and for ultimate stage rs F = (7) 3 2 2rs which is defined as the ratio of the ultimate lateral load of a shear wall with openings to that of a wall without openings. The predicted ultimate load capacity of a shear wall with openings is then Ppredict max(W.O.) = FP (8) The predicted load carrying capacities of shear walls with openings combined with experimental results are listed in Table 6. For the shear wall with conventional panels (wall 3), both equations conservatively underestimate the maximum capacity (8.9% by Patton-Mallory equation and 30.3% by Sugiyama equation). For the shear wall with oversize panel (wall 4), the Patton-Mallory equation overestimates the load carrying capacity by 29%, whereas the Sugiyama equation’s result is very close to the test value. It is evident that errors vary widely, showing that these simple equations may not be adequate to predict the performance of shear walls accurately. This is, however, understandable, because these are highly simplified equations and are intended for practical design applications using standard wood frame construction practice, which make them a good tool to provide a reasonable, and more importantly, conservative approximation of the strength of perforated shear walls. Furthermore, the predicted results for shear walls with different sheathing patterns are not consistent. For shear walls with regular panels, the predictions are conservative, whereas the predictions for shear walls with oversize panels tend to be overestimated. The approximate equations should thus not be used in this case. The discrepancy arises because oversize panels without openings have a comparatively high stiffness and strength level that can be lost to a large extent in the case of large openings. Another possible reason why the equations did not provide better prediction is that the empirical equations were developed based on test results of shear walls sheathed vertically with conventional panel and wall dimensions, while in present shear wall tests the orientation and dimension of sheathing panels were different from previous tests. It was also indicated in previous studies (Johnson and Dolan 1996; Line and Douglas 1996) that the error of prediction by the Sugiyama equation increases with increasing opening area ratios. Considering the variations in wall configurations (such as panel orientation and dimensions, and nail spacings), wall materials and test conditions, these equations may not be adequate in the analysis of shear walls in buildings other than standard 1-2 story residences. For a better prediction of the performance of shear walls, a more appropriate analytical methodology, such as numerical simulations, should be adopted. Numerical Analysis A nonlinear finite-element program, shear wall/diaphragm analysis program (DAP), developed by Foschi (1990), was used to predict the performance of perforated shear walls. The shear wall model in this program consists of four basic structural components: sheathing panel, frame, connections between frame members, and connections between panel and frame. It is assumed that the panel is subject to a plane stress field and has elastic orthotropic material properties. The frame members are considered as beam elements and assumed to be linear elastic. Nonlinear spring elements are used to model two types of nail connectors either between frame members or between panel and frame. The nonlinearity of the shear wall assembly is therefore solely determined by the behavior of the nail connectors. The numerical results from DAP for perforated shear walls built with conventional and oversize panels combined with experimental curves are shown in Fig. 12. The properties for the components used in the model were obtained from experimental tests. It can be seen that these numerical curves reveal convincingly the nonlinear behavior of perforated shear walls. The predicted lateral load carrying capacities for shear walls 3 (conventional panels with openings) and 4 (oversize panel with openings) are 38 kN and 62 kN. They are 16 and 3% lower than the results from tests, respectively, showing conservative, but reasonable estimates in shear wall strength. The predicted stiffness values for both walls, however, are significantly lower than the test values, causing a separation of numerical curves from experimental curves from the very beginning. After examining the distribution of in-plane shear stresses calculated by DAP, it is observed that the highest shear stresses occur around the corners of door and window openings, presenting a good prediction in panel failure modes which matched observations in the shear wall tests (discussed previously). Downloaded 05 Jan 2009 to 222.66.175.206. Redistribution subject to ASCE license or copyright; see http://pubs.asce.org/copyright