正在加载图片...
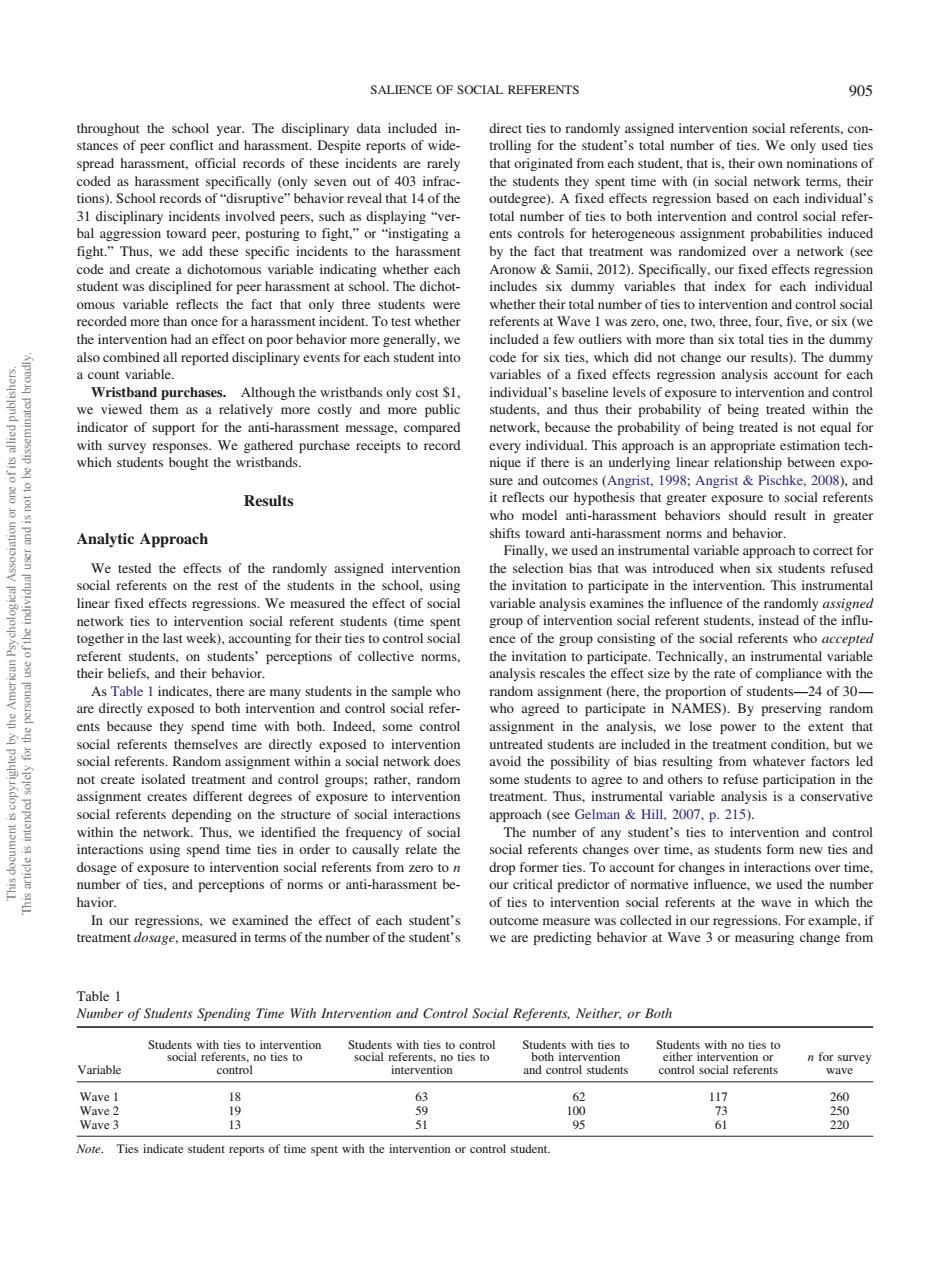
SALIENCE OF SOCIAL REFERENTS 905 throughout the school year.The disciplinary data included in hat originated from eac student.that is.their own nominations o hara (in of ties to both variable reflects the fact that only three tudents wer ode f six ties,which did not change results) effects regre Although the wristband tudents of eing ated with rof support fo which students bought the wristbands nique if there is an lying lincar ship betweer Results to social refe model ssmen uld Analytic Approach inally.w used an instn ental variab ach to correct fo ariable camines the influen ce of the ran As Table 1 indica there are many students in the sample who m assienment (here the contolsocilfrefd who to part cial referents t bu a social network ty o Thus ysis is a conservative of soci on and contro using spend time ties in order to causally relate the students form new ties and umber of ties.and perceptions of be critical predictor of nor ative influe we used the numbe ties to inte ocial reterents at the wav in whic der we are predicting behavior at Wave3 or measuring change from Number of Suudents Spending Time With Intervention and Control Social Referents.Neither.or Both Variable 。for rvey 69 throughout the school year. The disciplinary data included instances of peer conflict and harassment. Despite reports of widespread harassment, official records of these incidents are rarely coded as harassment specifically (only seven out of 403 infractions). School records of “disruptive” behavior reveal that 14 of the 31 disciplinary incidents involved peers, such as displaying “verbal aggression toward peer, posturing to fight,” or “instigating a fight.” Thus, we add these specific incidents to the harassment code and create a dichotomous variable indicating whether each student was disciplined for peer harassment at school. The dichotomous variable reflects the fact that only three students were recorded more than once for a harassment incident. To test whether the intervention had an effect on poor behavior more generally, we also combined all reported disciplinary events for each student into a count variable. Wristband purchases. Although the wristbands only cost $1, we viewed them as a relatively more costly and more public indicator of support for the anti-harassment message, compared with survey responses. We gathered purchase receipts to record which students bought the wristbands. Results Analytic Approach We tested the effects of the randomly assigned intervention social referents on the rest of the students in the school, using linear fixed effects regressions. We measured the effect of social network ties to intervention social referent students (time spent together in the last week), accounting for their ties to control social referent students, on students’ perceptions of collective norms, their beliefs, and their behavior. As Table 1 indicates, there are many students in the sample who are directly exposed to both intervention and control social referents because they spend time with both. Indeed, some control social referents themselves are directly exposed to intervention social referents. Random assignment within a social network does not create isolated treatment and control groups; rather, random assignment creates different degrees of exposure to intervention social referents depending on the structure of social interactions within the network. Thus, we identified the frequency of social interactions using spend time ties in order to causally relate the dosage of exposure to intervention social referents from zero to n number of ties, and perceptions of norms or anti-harassment behavior. In our regressions, we examined the effect of each student’s treatment dosage, measured in terms of the number of the student’s direct ties to randomly assigned intervention social referents, controlling for the student’s total number of ties. We only used ties that originated from each student, that is, their own nominations of the students they spent time with (in social network terms, their outdegree). A fixed effects regression based on each individual’s total number of ties to both intervention and control social referents controls for heterogeneous assignment probabilities induced by the fact that treatment was randomized over a network (see Aronow & Samii, 2012). Specifically, our fixed effects regression includes six dummy variables that index for each individual whether their total number of ties to intervention and control social referents at Wave 1 was zero, one, two, three, four, five, or six (we included a few outliers with more than six total ties in the dummy code for six ties, which did not change our results). The dummy variables of a fixed effects regression analysis account for each individual’s baseline levels of exposure to intervention and control students, and thus their probability of being treated within the network, because the probability of being treated is not equal for every individual. This approach is an appropriate estimation technique if there is an underlying linear relationship between exposure and outcomes (Angrist, 1998; Angrist & Pischke, 2008), and it reflects our hypothesis that greater exposure to social referents who model anti-harassment behaviors should result in greater shifts toward anti-harassment norms and behavior. Finally, we used an instrumental variable approach to correct for the selection bias that was introduced when six students refused the invitation to participate in the intervention. This instrumental variable analysis examines the influence of the randomly assigned group of intervention social referent students, instead of the influence of the group consisting of the social referents who accepted the invitation to participate. Technically, an instrumental variable analysis rescales the effect size by the rate of compliance with the random assignment (here, the proportion of students—24 of 30— who agreed to participate in NAMES). By preserving random assignment in the analysis, we lose power to the extent that untreated students are included in the treatment condition, but we avoid the possibility of bias resulting from whatever factors led some students to agree to and others to refuse participation in the treatment. Thus, instrumental variable analysis is a conservative approach (see Gelman & Hill, 2007, p. 215). The number of any student’s ties to intervention and control social referents changes over time, as students form new ties and drop former ties. To account for changes in interactions over time, our critical predictor of normative influence, we used the number of ties to intervention social referents at the wave in which the outcome measure was collected in our regressions. For example, if we are predicting behavior at Wave 3 or measuring change from Table 1 Number of Students Spending Time With Intervention and Control Social Referents, Neither, or Both Variable Students with ties to intervention social referents, no ties to control Students with ties to control social referents, no ties to intervention Students with ties to both intervention and control students Students with no ties to either intervention or control social referents n for survey wave Wave 1 18 63 62 117 260 Wave 2 19 59 100 73 250 Wave 3 13 51 95 61 220 Note. Ties indicate student reports of time spent with the intervention or control student. SALIENCE OF SOCIAL REFERENTS 905 This document is copyrighted by the American Psychological Association or one of its allied publishers. This article is intended solely for the personal use of the individual user and is not to be disseminated broadly