正在加载图片...
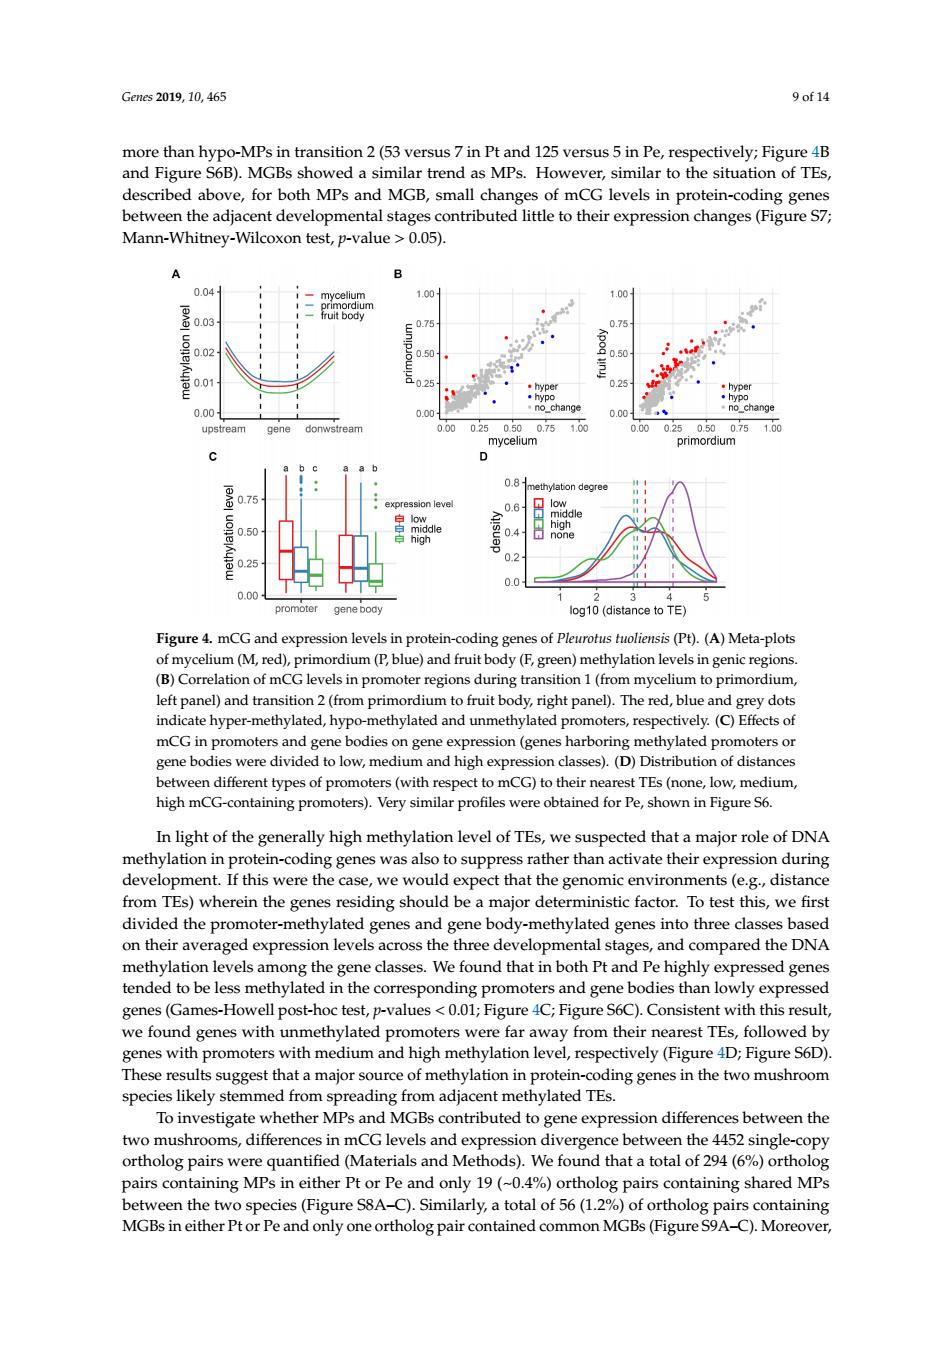
Gms2019.10.465 9of14 more than hypo-MPs in transition 2(53 versus 7 in Pt and 125 versus 5 in Pe,respectively;Figure 4B and Figure S6B).MGBs showed a similar trend as MPs.However,similar to the situation of TEs, described above,for both MPs and MGB,small changes of mCG levels in protein-coding genes etween the adjacent developmental stages contributed little to their expression changes(Figure S7 Mann-Whitney-Wilcoxon test,p-value >0.05). B 101 gene boay Figure 4.mCG and ex on levels oding gene sof Pleurotus tuoliensis (P)(A)Meta-plots um (F, F,gre left panel)and transition2(from primordium to fruit body right panel). y dots indicate hyper-methylated,hypo-methylated and unmethylated promoters,respectively.(C)Effects of mCG in promoters and gene bodies on gene expression(genes harboring methylated promotersor t to mcG)to their TEe (o medium, In light of the generally high methylation level of TEs,we suspected that a major role of DNA methylation in protein-coding genes was also to suppress rather than activate their expression during development.If this were the case,we would expect that the genomic environments(e.g.,distance from TEs)wherein the genes residing should be a major deterministic factor.To test this,we first divided the promoter-methylated genes and gene body-methylated genes into three clas on thei tal stage ompared the N ind ad i ly exp es (Games-Howell ure 4C:Figu eS6C)Consistent with this resul efounwth unmethylated promoters were far away from their nearest TEs,followed by genes with promoters with medium and high methylation level,respectively(Figure 4D:Figure S6D). These results suggest that a major source of methylation in protein-coding genes in the two mushroom species likely stemmed from spreading from adjacent methylated TEs. To investigat whether MPs and MGBs contributed to gene expression differences between the shrooms,differences in mG lev single ng MPs Pt or Pe and MP total of 56 11 og paf orthol MGBs in either Ptor Pe and only one ortholog pair contined common MGBs(Fgure Genes 2019, 10, 465 9 of 14 more than hypo-MPs in transition 2 (53 versus 7 in Pt and 125 versus 5 in Pe, respectively; Figure 4B and Figure S6B). MGBs showed a similar trend as MPs. However, similar to the situation of TEs, described above, for both MPs and MGB, small changes of mCG levels in protein-coding genes between the adjacent developmental stages contributed little to their expression changes (Figure S7; Mann-Whitney-Wilcoxon test, p-value > 0.05). Genes 2019, 10, x FOR PEER REVIEW 9 of 14 However, similar to the situation of TEs, described above, for both MPs and MGB, small changes of mCG levels in protein-coding genes between the adjacent developmental stages contributed little to their expression changes (Figure S7; Mann-Whitney-Wilcoxon test, p-value > 0.05). Figure 4. mCG and expression levels in protein-coding genes of Pleurotus tuoliensis (Pt). (A) Metaplots of mycelium (M, red), primordium (P, blue) and fruit body (F, green) methylation levels in genic regions. (B) Correlation of mCG levels in promoter regions during transition 1 (from mycelium to primordium, left panel) and transition 2 (from primordium to fruit body, right panel). The red, blue and grey dots indicate hyper-methylated, hypo-methylated and unmethylated promoters, respectively. (C) Effects of mCG in promoters and gene bodies on gene expression (genes harboring methylated promoters or gene bodies were divided to low, medium and high expression classes). (D) Distribution of distances between different types of promoters (with respect to mCG) to their nearest TEs (none, low, medium, high mCG-containing promoters). Very similar profiles were obtained for Pe, shown in Figure S6. In light of the generally high methylation level of TEs, we suspected that a major role of DNA methylation in protein-coding genes was also to suppress rather than activate their expression during development. If this were the case, we would expect that the genomic environments (e.g., distance from TEs) wherein the genes residing should be a major deterministic factor. To test this, we first divided the promoter-methylated genes and gene body-methylated genes into three classes based on their averaged expression levels across the three developmental stages, and compared the DNA methylation levels among the gene classes. We found that in both Pt and Pe highly expressed genes tended to be less methylated in the corresponding promoters and gene bodies than lowly expressed genes (Games-Howell post-hoc test, p-values < 0.01; Figure 4C; Figure S6C). Consistent with this result, we found genes with unmethylated promoters were far away from their nearest TEs, followed by genes with promoters with medium and high methylation level, respectively (Figure 4D; Figure S6D). These results suggest that a major source of methylation in protein-coding genes in the two mushroom species likely stemmed from spreading from adjacent methylated TEs. To investigate whether MPs and MGBs contributed to gene expression differences between the two mushrooms, differences in mCG levels and expression divergence between the 4452 single-copy ortholog pairs were quantified (Materials and Methods). We found that a total of 294 (6%) ortholog pairs containing MPs in either Pt or Pe and only 19 (~0.4%) ortholog pairs containing shared MPs between the two species (Figure S8A–C). Similarly, a total of 56 (1.2%) of ortholog pairs containing MGBs in either Pt or Pe and only one ortholog pair contained common MGBs (Figure S9A–C). Figure 4. mCG and expression levels in protein-coding genes of Pleurotus tuoliensis (Pt). (A) Meta-plots of mycelium (M, red), primordium (P, blue) and fruit body (F, green) methylation levels in genic regions. (B) Correlation of mCG levels in promoter regions during transition 1 (from mycelium to primordium, left panel) and transition 2 (from primordium to fruit body, right panel). The red, blue and grey dots indicate hyper-methylated, hypo-methylated and unmethylated promoters, respectively. (C) Effects of mCG in promoters and gene bodies on gene expression (genes harboring methylated promoters or gene bodies were divided to low, medium and high expression classes). (D) Distribution of distances between different types of promoters (with respect to mCG) to their nearest TEs (none, low, medium, high mCG-containing promoters). Very similar profiles were obtained for Pe, shown in Figure S6. In light of the generally high methylation level of TEs, we suspected that a major role of DNA methylation in protein-coding genes was also to suppress rather than activate their expression during development. If this were the case, we would expect that the genomic environments (e.g., distance from TEs) wherein the genes residing should be a major deterministic factor. To test this, we first divided the promoter-methylated genes and gene body-methylated genes into three classes based on their averaged expression levels across the three developmental stages, and compared the DNA methylation levels among the gene classes. We found that in both Pt and Pe highly expressed genes tended to be less methylated in the corresponding promoters and gene bodies than lowly expressed genes (Games-Howell post-hoc test, p-values < 0.01; Figure 4C; Figure S6C). Consistent with this result, we found genes with unmethylated promoters were far away from their nearest TEs, followed by genes with promoters with medium and high methylation level, respectively (Figure 4D; Figure S6D). These results suggest that a major source of methylation in protein-coding genes in the two mushroom species likely stemmed from spreading from adjacent methylated TEs. To investigate whether MPs and MGBs contributed to gene expression differences between the two mushrooms, differences in mCG levels and expression divergence between the 4452 single-copy ortholog pairs were quantified (Materials and Methods). We found that a total of 294 (6%) ortholog pairs containing MPs in either Pt or Pe and only 19 (~0.4%) ortholog pairs containing shared MPs between the two species (Figure S8A–C). Similarly, a total of 56 (1.2%) of ortholog pairs containing MGBs in either Pt or Pe and only one ortholog pair contained common MGBs (Figure S9A–C). Moreover