正在加载图片...
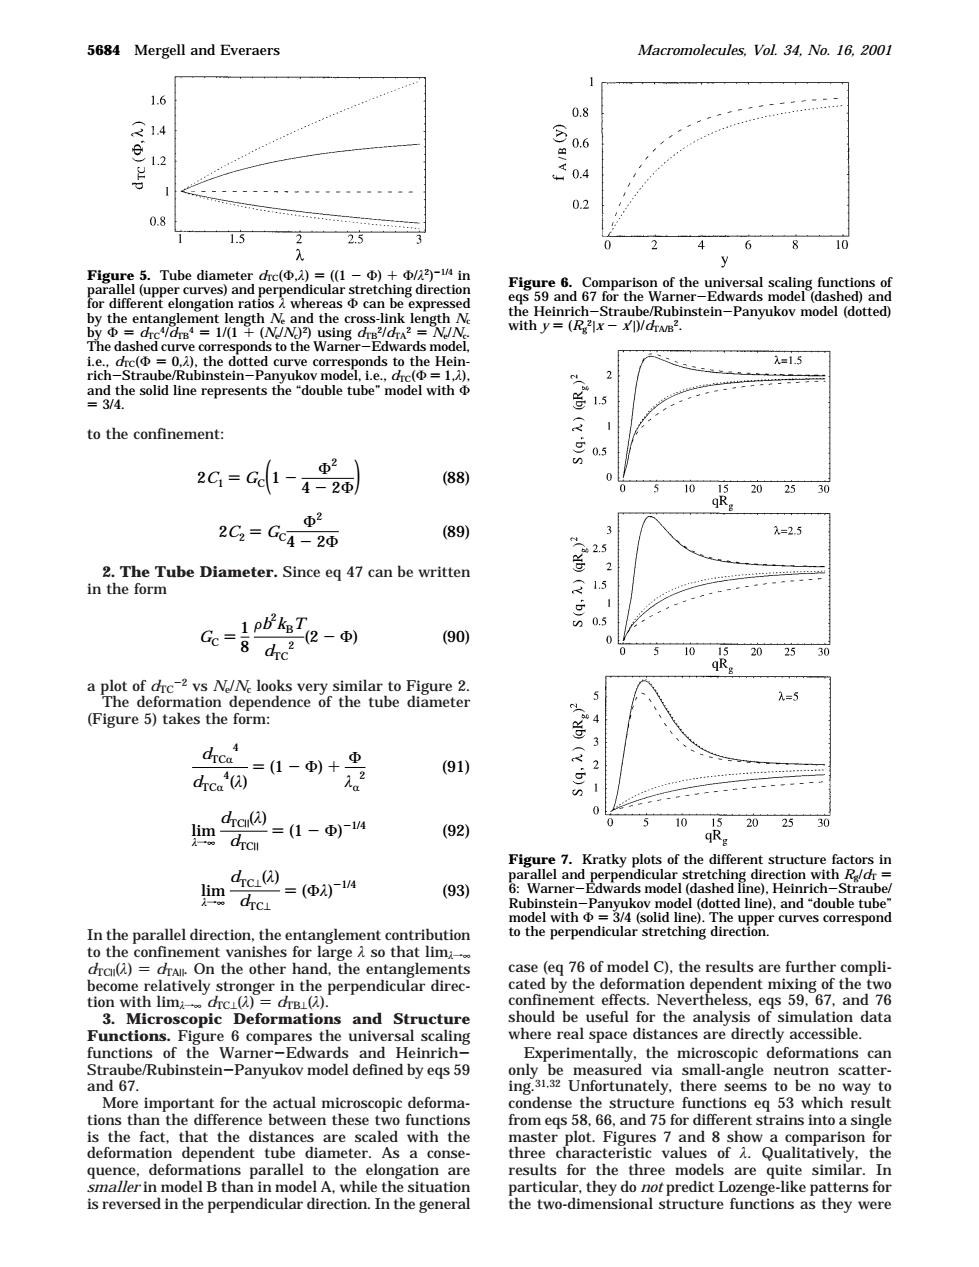
5684 Mergell and Everaers Macromolecules,Vol.34.No.16.2001 1.6 02 08 15 25 2 4 6 8 10 Figure 5.Tube d e( he entan era nstein-Par ko model (dotted) =0,) the F rich be solid line ec 15 to the confinement: 2G=- 05 88 20 2G=C =25 2币 89) -e- (90) emn ependncef he tube diameter =5 (Figure 5)takes the form: drca (91) 画9=1- (92) 典 =(便4 (93) 89 ted line). del with中=34 Gsolid line and"double tub In the parallel direction.the entanglement conribution liments ent effects a Ne 9.67,and the s and Structure einrich deformations car be way to hemathtcthendtiaceaameealagaitnhe the elo situ ts fo he three model are te similar is reversed in the perpendicular direction.In the general the two-dimensional structure functions as they wereto the confinement: 2. The Tube Diameter. Since eq 47 can be written in the form a plot of dTC-2 vs Ne/Nc looks very similar to Figure 2. The deformation dependence of the tube diameter (Figure 5) takes the form: In the parallel direction, the entanglement contribution to the confinement vanishes for large λ so that limλf∞ dTC|(λ) ) dTA|. On the other hand, the entanglements become relatively stronger in the perpendicular direction with limλf∞ dTC⊥(λ) ) dTB⊥(λ). 3. Microscopic Deformations and Structure Functions. Figure 6 compares the universal scaling functions of the Warner-Edwards and HeinrichStraube/Rubinstein-Panyukov model defined by eqs 59 and 67. More important for the actual microscopic deformations than the difference between these two functions is the fact, that the distances are scaled with the deformation dependent tube diameter. As a consequence, deformations parallel to the elongation are smaller in model B than in model A, while the situation is reversed in the perpendicular direction. In the general case (eq 76 of model C), the results are further complicated by the deformation dependent mixing of the two confinement effects. Nevertheless, eqs 59, 67, and 76 should be useful for the analysis of simulation data where real space distances are directly accessible. Experimentally, the microscopic deformations can only be measured via small-angle neutron scattering.31,32 Unfortunately, there seems to be no way to condense the structure functions eq 53 which result from eqs 58, 66, and 75 for different strains into a single master plot. Figures 7 and 8 show a comparison for three characteristic values of λ. Qualitatively, the results for the three models are quite similar. In particular, they do not predict Lozenge-like patterns for the two-dimensional structure functions as they were Figure 5. Tube diameter dTC(Φ,λ) ) ((1 - Φ) + Φ/λ2)-1/4 in parallel (upper curves) and perpendicular stretching direction for different elongation ratios λ whereas Φ can be expressed by the entanglement length Ne and the cross-link length Nc by Φ ) dTC4/dTB4 ) 1/(1 + (Ne/Nc)2) using dTB2/dTA2 ) Ne/Nc. The dashed curve corresponds to the Warner-Edwards model, i.e., dTC(Φ ) 0,λ), the dotted curve corresponds to the Heinrich-Straube/Rubinstein-Panyukov model, i.e., dTC(Φ ) 1,λ), and the solid line represents the “double tube” model with Φ ) 3/4. Figure 6. Comparison of the universal scaling functions of eqs 59 and 67 for the Warner-Edwards model (dashed) and the Heinrich-Straube/Rubinstein-Panyukov model (dotted) with y ) (Rg 2|x - x′|)/dTA/B2. Figure 7. Kratky plots of the different structure factors in parallel and perpendicular stretching direction with Rg/dT ) 6: Warner-Edwards model (dashed line), Heinrich-Straube/ Rubinstein-Panyukov model (dotted line), and “double tube” model with Φ ) 3/4 (solid line). The upper curves correspond to the perpendicular stretching direction. 2C1 ) GC(1 - Φ2 4 - 2Φ) (88) 2C2 ) GC Φ2 4 - 2Φ (89) GC ) 1 8 Fb2 kBT dTC 2 (2 - Φ) (90) dTCR 4 dTCR 4 (λ) ) (1 - Φ) + Φ λR 2 (91) lim λf∞ dTC|(λ) dTC| ) (1 - Φ) -1/4 (92) lim λf∞ dTC⊥(λ) dTC⊥ ) (Φλ) -1/4 (93) 5684 Mergell and Everaers Macromolecules, Vol. 34, No. 16, 2001