正在加载图片...
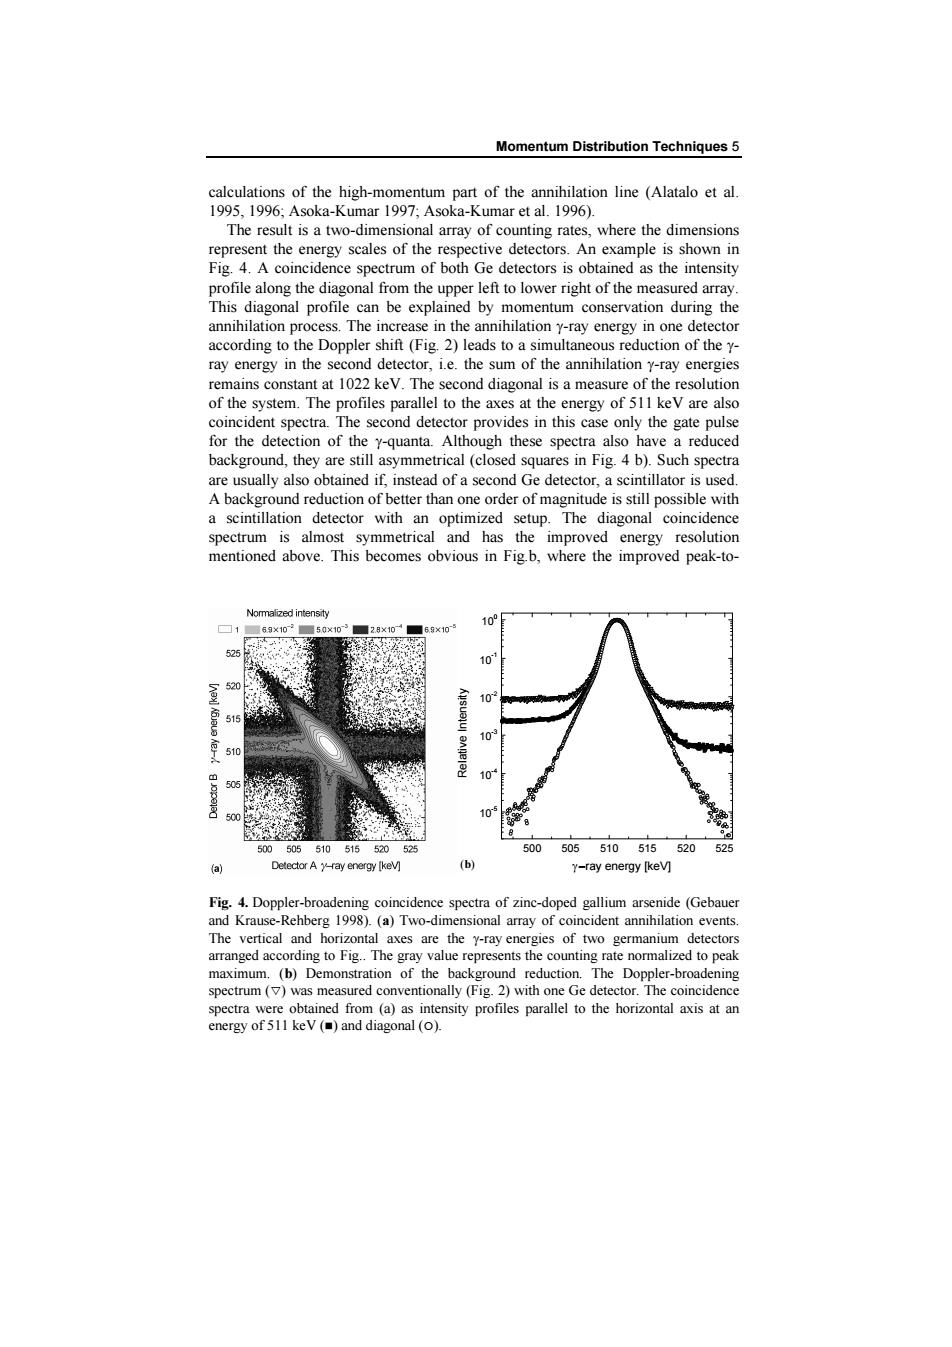
Momentum Distribution Techniques 5 calculations of the high-momentum part of the annihilation line (Alatalo et al. 1995,1996;Asoka-Kumar 1997;Asoka-Kumar et al.1996). The result is a two-dimensional array of counting rates,where the dimensions represent the energy scales of the respective detectors.An example is shown in Fig.4.A coincidence spectrum of both Ge detectors is obtained as the intensity profile along the diagonal from the upper left to lower right of the measured array This diagonal profile can be explained by momentum conservation during the annihilation process.The increase in the annihilation y-ray energy in one detector according to the Doppler shift(Fig.2)leads to a simultaneous reduction of the y- ray energy in the second detector,i.e.the sum of the annihilation y-ray energies remains constant at 1022 keV.The second diagonal is a measure of the resolution of the system.The profiles parallel to the axes at the energy of 511 keV are also coincident spectra.The second detector provides in this case only the gate pulse for the detection of the y-quanta.Although these spectra also have a reduced background,they are still asymmetrical (closed squares in Fig.4 b).Such spectra are usually also obtained if,instead of a second Ge detector,a scintillator is used A background reduction of better than one order of magnitude is still possible with a scintillation detector with an optimized setup.The diagonal coincidence spectrum is almost symmetrical and has the improved energy resolution mentioned above.This becomes obvious in Fig.b,where the improved peak-to- Normalized intensity 10 1 83×10 50×102 28×10 610 10 520 515 0 分 510 10 500505.510515520525 500505510515520 525 Detector A y-ray energy [kev] (b) y-ray energy [kev] Fig.4.Doppler-broadening coincidence spectra of zinc-doped gallium arsenide (Gebauer and Krause-Rehberg 1998).(a)Two-dimensional array of coincident annihilation events. The vertical and horizontal axes are the y-ray energies of two germanium detectors arranged according to Fig..The gray value represents the counting rate normalized to peak maximum.(b)Demonstration of the background reduction.The Doppler-broadening spectrum (v)was measured conventionally (Fig.2)with one Ge detector.The coincidence spectra were obtained from (a)as intensity profiles parallel to the horizontal axis at an energy of 511 keV ()and diagonal (o).Momentum Distribution Techniques 5 calculations of the high-momentum part of the annihilation line (Alatalo et al. 1995, 1996; Asoka-Kumar 1997; Asoka-Kumar et al. 1996). The result is a two-dimensional array of counting rates, where the dimensions represent the energy scales of the respective detectors. An example is shown in Fig. 4. A coincidence spectrum of both Ge detectors is obtained as the intensity profile along the diagonal from the upper left to lower right of the measured array. This diagonal profile can be explained by momentum conservation during the annihilation process. The increase in the annihilation g-ray energy in one detector according to the Doppler shift (Fig. 2) leads to a simultaneous reduction of the gray energy in the second detector, i.e. the sum of the annihilation g-ray energies remains constant at 1022 keV. The second diagonal is a measure of the resolution of the system. The profiles parallel to the axes at the energy of 511 keV are also coincident spectra. The second detector provides in this case only the gate pulse for the detection of the g-quanta. Although these spectra also have a reduced background, they are still asymmetrical (closed squares in Fig. 4 b). Such spectra are usually also obtained if, instead of a second Ge detector, a scintillator is used. A background reduction of better than one order of magnitude is still possible with a scintillation detector with an optimized setup. The diagonal coincidence spectrum is almost symmetrical and has the improved energy resolution mentioned above. This becomes obvious in Fig.b, where the improved peak-to- 500 505 510 515 520 525 10-5 10-4 10-3 10-2 10-1 100 (b)Relative Intensity g–ray energy [keV] Fig. 4. Doppler-broadening coincidence spectra of zinc-doped gallium arsenide (Gebauer and Krause-Rehberg 1998). (a) Two-dimensional array of coincident annihilation events. The vertical and horizontal axes are the g-ray energies of two germanium detectors arranged according to Fig.. The gray value represents the counting rate normalized to peak maximum. (b) Demonstration of the background reduction. The Doppler-broadening spectrum (s) was measured conventionally (Fig. 2) with one Ge detector. The coincidence spectra were obtained from (a) as intensity profiles parallel to the horizontal axis at an energy of 511 keV (n) and diagonal (°)