正在加载图片...
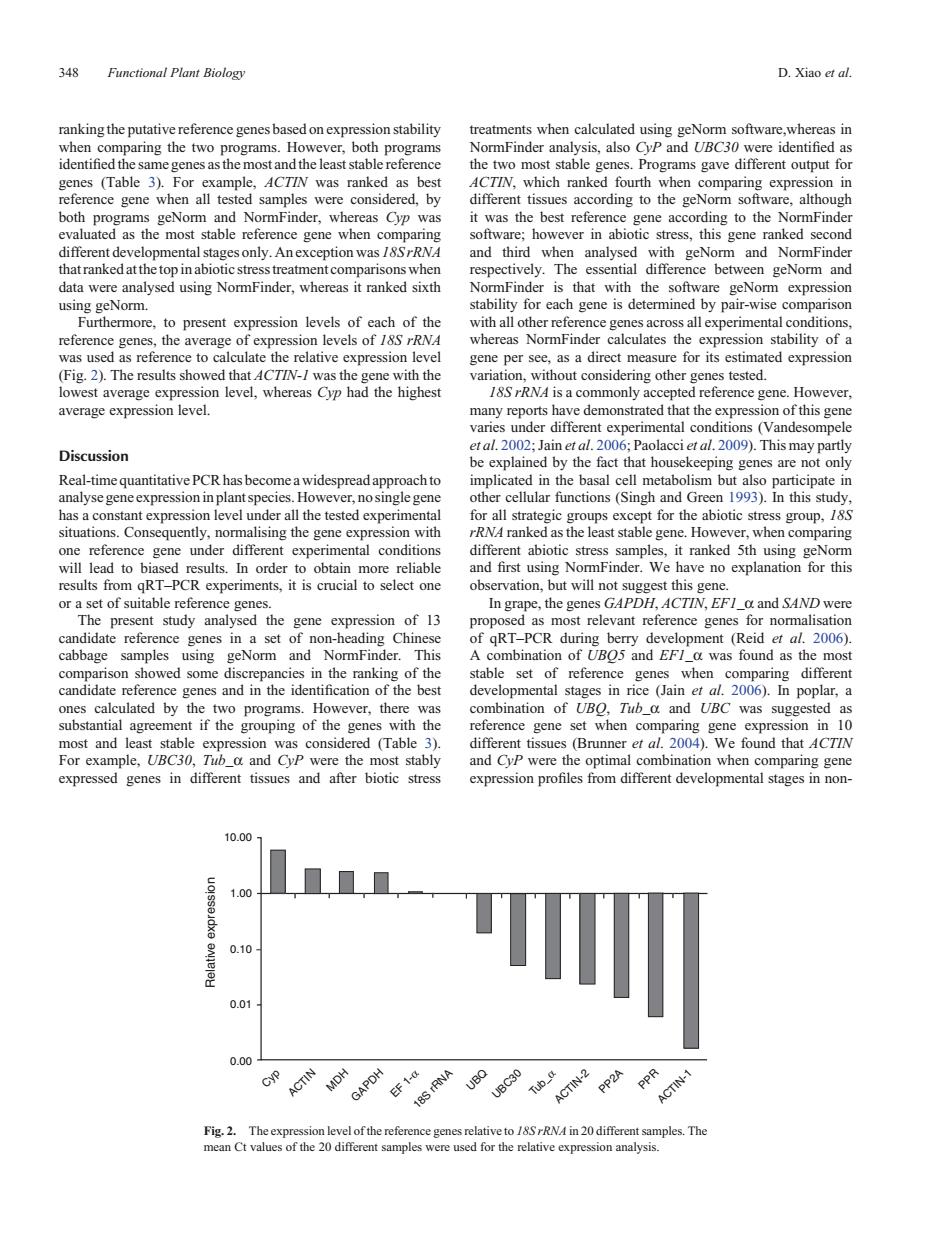
348 Functional Plant Biology D.Xiao et al. ranking the putative reference genes based on expression stability treatments when calculated using geNorm software,whereas in when comparing the two programs.However,both programs NormFinder analysis,also CyP and UBC30 were identified as identified the same genes as the most and the least stable reference the two most stable genes.Programs gave different output for genes (Table 3).For example,ACTIN was ranked as best ACTIN.which ranked fourth when comparing expression in reference gene when all tested samples were considered,by different tissues according to the geNorm software,although both programs geNorm and NormFinder,whereas Cyp was it was the best reference gene according to the NormFinder evaluated as the most stable reference gene when comparing software;however in abiotic stress,this gene ranked second different developmental stages only.An exception was /8SrRNA and third when analysed with geNorm and NormFinder that ranked at the top in abiotic stress treatment comparisons when respectively.The essential difference between geNorm and data were analysed using NormFinder,whereas it ranked sixth NormFinder is that with the software geNorm expression using geNorm. stability for each gene is determined by pair-wise comparison Furthermore,to present expression levels of each of the with all other reference genes across all experimental conditions, reference genes,the average of expression levels of /8S rRNA whereas NormFinder calculates the expression stability of a was used as reference to calculate the relative expression level gene per see,as a direct measure for its estimated expression (Fig.2).The results showed that ACTIN-/was the gene with the variation,without considering other genes tested. lowest average expression level,whereas Cyp had the highest 18S rRNA is a commonly accepted reference gene.However, average expression level. many reports have demonstrated that the expression of this gene varies under different experimental conditions (Vandesompele Discussion etal.2002;Jain et al.2006;Paolacciet al.2009).This may partly be explained by the fact that housekeeping genes are not only Real-time quantitative PCR has become a widespread approach to implicated in the basal cell metabolism but also participate in analyse gene expression in plant species.However,no single gene other cellular functions(Singh and Green 1993).In this study, has a constant expression level under all the tested experimental for all strategic groups except for the abiotic stress group,18S situations.Consequently,normalising the gene expression with rRNA ranked as the least stable gene.However,when comparing one reference gene under different experimental conditions different abiotic stress samples,it ranked 5th using geNorm will lead to biased results.In order to obtain more reliable and first using NormFinder.We have no explanation for this results from qRT-PCR experiments,it is crucial to select one observation,but will not suggest this gene. or a set of suitable reference genes. In grape,the genes GAPDH,ACTIN,EFI_a and SAND were The present study analysed the gene expression of 13 proposed as most relevant reference genes for normalisation candidate reference genes in a set of non-heading Chinese of qRT-PCR during berry development (Reid et al.2006). cabbage samples using geNorm and NormFinder.This A combination of UBO5 and EFI a was found as the most comparison showed some discrepancies in the ranking of the stable set of reference genes when comparing different candidate reference genes and in the identification of the best developmental stages in rice (Jain et al.2006).In poplar,a ones calculated by the two programs.However,there was combination of UBO,Tub_a and UBC was suggested as substantial agreement if the grouping of the genes with the reference gene set when comparing gene expression in 10 most and least stable expression was considered (Table 3). different tissues (Brunner et al.2004).We found that ACTIN For example,UBC30,Tub a and CyP were the most stably and CyP were the optimal combination when comparing gene expressed genes in different tissues and after biotic stress expression profiles from different developmental stages in non- 10.00 1.00 0.10 0.01 0.00 手S0叶 18S ACTIN-1 Fig.2.The expression level of the reference genes relative to 1&SrRNA in20 different samples.The mean Ct values of the 20 different samples were used for the relative expression analysis.ranking the putative reference genes based on expression stability when comparing the two programs. However, both programs identified the same genes as the most and the least stable reference genes (Table 3). For example, ACTIN was ranked as best reference gene when all tested samples were considered, by both programs geNorm and NormFinder, whereas Cyp was evaluated as the most stable reference gene when comparing different developmental stages only. An exception was 18S rRNA that ranked at the top in abiotic stress treatment comparisons when data were analysed using NormFinder, whereas it ranked sixth using geNorm. Furthermore, to present expression levels of each of the reference genes, the average of expression levels of 18S rRNA was used as reference to calculate the relative expression level (Fig. 2). The results showed that ACTIN-1 was the gene with the lowest average expression level, whereas Cyp had the highest average expression level. Discussion Real-time quantitative PCR has become a widespread approach to analyse gene expression in plant species. However, no single gene has a constant expression level under all the tested experimental situations. Consequently, normalising the gene expression with one reference gene under different experimental conditions will lead to biased results. In order to obtain more reliable results from qRT–PCR experiments, it is crucial to select one or a set of suitable reference genes. The present study analysed the gene expression of 13 candidate reference genes in a set of non-heading Chinese cabbage samples using geNorm and NormFinder. This comparison showed some discrepancies in the ranking of the candidate reference genes and in the identification of the best ones calculated by the two programs. However, there was substantial agreement if the grouping of the genes with the most and least stable expression was considered (Table 3). For example, UBC30, Tub_a and CyP were the most stably expressed genes in different tissues and after biotic stress treatments when calculated using geNorm software,whereas in NormFinder analysis, also CyP and UBC30 were identified as the two most stable genes. Programs gave different output for ACTIN, which ranked fourth when comparing expression in different tissues according to the geNorm software, although it was the best reference gene according to the NormFinder software; however in abiotic stress, this gene ranked second and third when analysed with geNorm and NormFinder respectively. The essential difference between geNorm and NormFinder is that with the software geNorm expression stability for each gene is determined by pair-wise comparison with all other reference genes across all experimental conditions, whereas NormFinder calculates the expression stability of a gene per see, as a direct measure for its estimated expression variation, without considering other genes tested. 18S rRNA is a commonly accepted reference gene. However, many reports have demonstrated that the expression of this gene varies under different experimental conditions (Vandesompele et al. 2002; Jain et al. 2006; Paolacci et al. 2009). This may partly be explained by the fact that housekeeping genes are not only implicated in the basal cell metabolism but also participate in other cellular functions (Singh and Green 1993). In this study, for all strategic groups except for the abiotic stress group, 18S rRNA ranked as the least stable gene. However, when comparing different abiotic stress samples, it ranked 5th using geNorm and first using NormFinder. We have no explanation for this observation, but will not suggest this gene. In grape, the genes GAPDH, ACTIN, EF1_a and SAND were proposed as most relevant reference genes for normalisation of qRT–PCR during berry development (Reid et al. 2006). A combination of UBQ5 and EF1_a was found as the most stable set of reference genes when comparing different developmental stages in rice (Jain et al. 2006). In poplar, a combination of UBQ, Tub_a and UBC was suggested as reference gene set when comparing gene expression in 10 different tissues (Brunner et al. 2004). We found that ACTIN and CyP were the optimal combination when comparing gene expression profiles from different developmental stages in non- 10.00 Relative expression 1.00 0.10 0.01 0.00 Cyp ACTIN MDH GAPDH EF 1-α 18S rRNA UBQ UBC30 Tub_α ACTIN-2 PP2A PPR ACTIN-1 Fig. 2. The expression level of the reference genes relative to 18S rRNA in 20 different samples. The mean Ct values of the 20 different samples were used for the relative expression analysis. 348 Functional Plant Biology D. Xiao et al