正在加载图片...
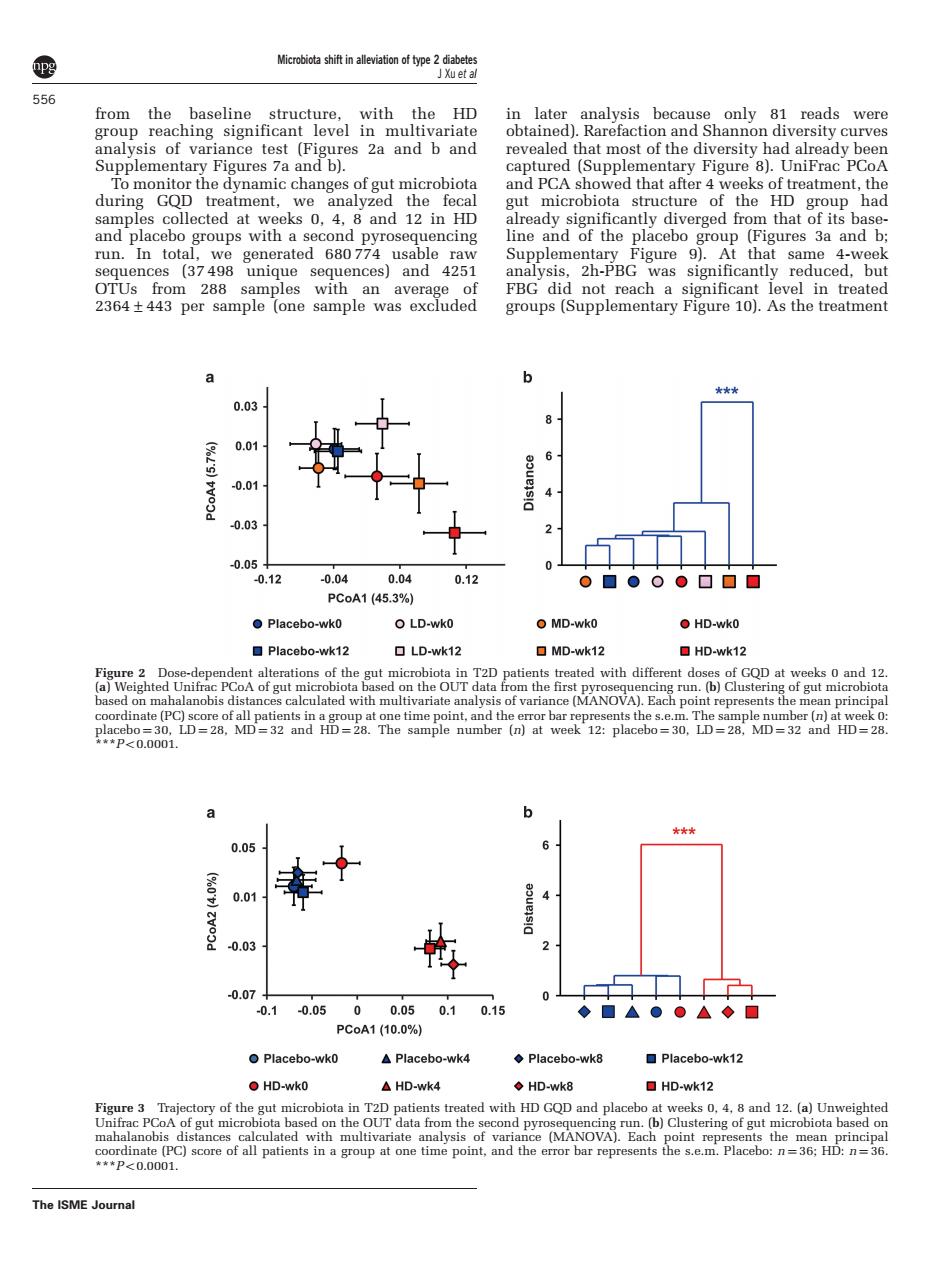
556 from the rsity curves most o peTstyghadapeadypbee and PCA show seks 0.4.8 and 12 in Hp m that f its bas ne and c analysis2h-PBGaignificantly reduced.but a 6 ★★★ 00 001 0.01 0.03 -0.05 0.12 0.04 0.12 0■000▣▣▣ Placebo-wko OLD-wko MD-wk0 HD-wko ☐Placebo-wk12 LD-wk12 口MD-wk12 HD-wk12 gue Iterations of the eated with different d GOD at weeks o and 12 on th dinate (PC) 0.05 0.01 0.03 -0.07 -0.1 0.05 0.0 0.10.15 ◆■△●。△◆口 Placebo-wk0 ▲Placebo-wwk4 ◆Placebo-wk8 口Placebo-wk12 HD-wko △HD-wk4 ◆HD-wk8 HDwk12 ted wit alysis of variance (MANOVA).Each ts the score of all patients in a group at o ne point. d the e ror bar repres HD: The ISME Joural from the baseline structure, with the HD group reaching significant level in multivariate analysis of variance test (Figures 2a and b and Supplementary Figures 7a and b). To monitor the dynamic changes of gut microbiota during GQD treatment, we analyzed the fecal samples collected at weeks 0, 4, 8 and 12 in HD and placebo groups with a second pyrosequencing run. In total, we generated 680 774 usable raw sequences (37 498 unique sequences) and 4251 OTUs from 288 samples with an average of 2364±443 per sample (one sample was excluded in later analysis because only 81 reads were obtained). Rarefaction and Shannon diversity curves revealed that most of the diversity had already been captured (Supplementary Figure 8). UniFrac PCoA and PCA showed that after 4 weeks of treatment, the gut microbiota structure of the HD group had already significantly diverged from that of its baseline and of the placebo group (Figures 3a and b; Supplementary Figure 9). At that same 4-week analysis, 2h-PBG was significantly reduced, but FBG did not reach a significant level in treated groups (Supplementary Figure 10). As the treatment Figure 2 Dose-dependent alterations of the gut microbiota in T2D patients treated with different doses of GQD at weeks 0 and 12. (a) Weighted Unifrac PCoA of gut microbiota based on the OUT data from the first pyrosequencing run. (b) Clustering of gut microbiota based on mahalanobis distances calculated with multivariate analysis of variance (MANOVA). Each point represents the mean principal coordinate (PC) score of all patients in a group at one time point, and the error bar represents the s.e.m. The sample number (n) at week 0: placebo ¼ 30, LD ¼ 28, MD ¼ 32 and HD ¼ 28. The sample number (n) at week 12: placebo ¼ 30, LD ¼ 28, MD ¼ 32 and HD ¼ 28. ***Po0.0001. Figure 3 Trajectory of the gut microbiota in T2D patients treated with HD GQD and placebo at weeks 0, 4, 8 and 12. (a) Unweighted Unifrac PCoA of gut microbiota based on the OUT data from the second pyrosequencing run. (b) Clustering of gut microbiota based on mahalanobis distances calculated with multivariate analysis of variance (MANOVA). Each point represents the mean principal coordinate (PC) score of all patients in a group at one time point, and the error bar represents the s.e.m. Placebo: n ¼ 36; HD: n ¼ 36. ***Po0.0001. Microbiota shift in alleviation of type 2 diabetes J Xu et al 556 The ISME Journal