正在加载图片...
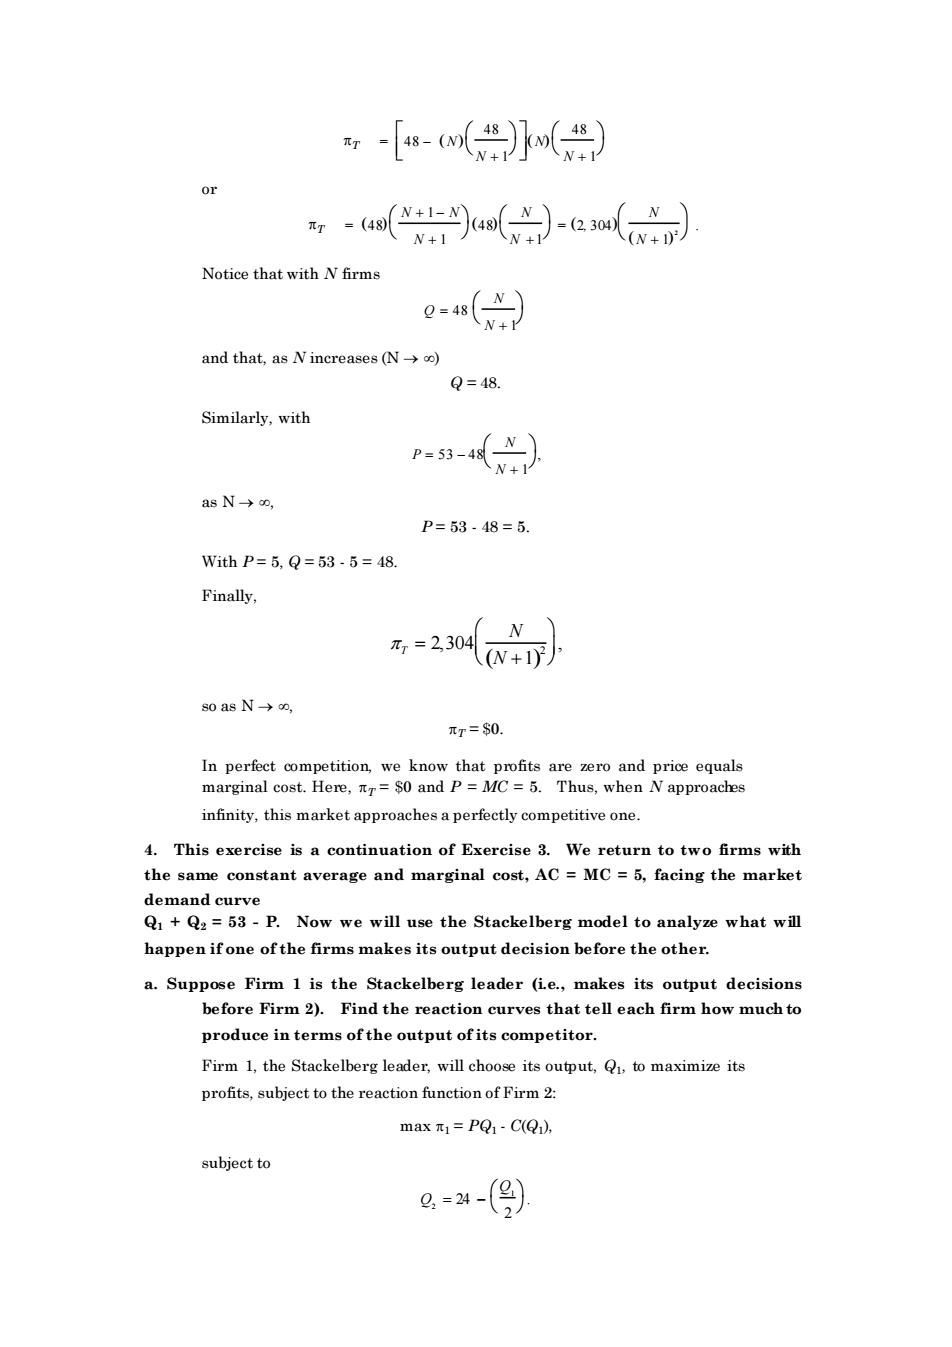
-[-(() or )G) N+1 Notice that with N firms e-() and that,as Nincreases (N) Q=48 Similarly.with 9-) asN→o, P=53-48=5. With P=5Q=53.5=48. Finally, =2300N+ 0asN→n m=$0. In perfect competition,we know that profits are zero and price equals marginal cost.Here,r=$0 and P=MC=5.Thus,when N approaches infinity,this market approaches a perfectly competitive one. 4.This exercise is a continuation of Exercise 3.We return to two firms with the same constant average and marginal cost,AC=MC=5,facing the market demand curve Q+Q=53-P.Now we will use the Stackelberg model to analyze what will happen ifone of the firms makes its output decision before the other. a.Suppose Firm 1 is the Stackelberg leader (i.e.,makes its output decisions before firm 2).Find the reaction curves that tell each firm how much to produce in terms of the output ofits competitor. Firm 1.the Stackelberg leader,will choose its output.to maximize its profits,subject to the reaction function of Firm2: max PQ-C(Q) subject to g=4-()T = 48 − ( N) 48 N + 1 ( N) 48 N + 1 or T = (4 8) N + 1 − N N + 1 (4 8) N N +1 = (2, 304) N ( N + 1) 2 . Notice that with N firms Q = 48 N N + 1 and that, as N increases (N → ) Q = 48. Similarly, with P = 53 − 48 N N + 1 , as N → , P = 53 - 48 = 5. With P = 5, Q = 53 - 5 = 48. Finally, T = 2,304 N (N +1) 2 , so as N → , T = $0. In perfect competition, we know that profits are zero and price equals marginal cost. Here, T = $0 and P = MC = 5. Thus, when N approaches infinity, this market approaches a perfectly competitive one. 4. This exercise is a continuation of Exercise 3. We return to two firms with the same constant average and marginal cost, AC = MC = 5, facing the market demand curve Q1 + Q2 = 53 - P. Now we will use the Stackelberg model to analyze what will happen if one of the firms makes its output decision before the other. a. Suppose Firm 1 is the Stackelberg leader (i.e., makes its output decisions before Firm 2). Find the reaction curves that tell each firm how much to produce in terms of the output of its competitor. Firm 1, the Stackelberg leader, will choose its output, Q1 , to maximize its profits, subject to the reaction function of Firm 2: max 1 = PQ1 - C(Q1 ), subject to Q2 = 24 − Q1 2