正在加载图片...
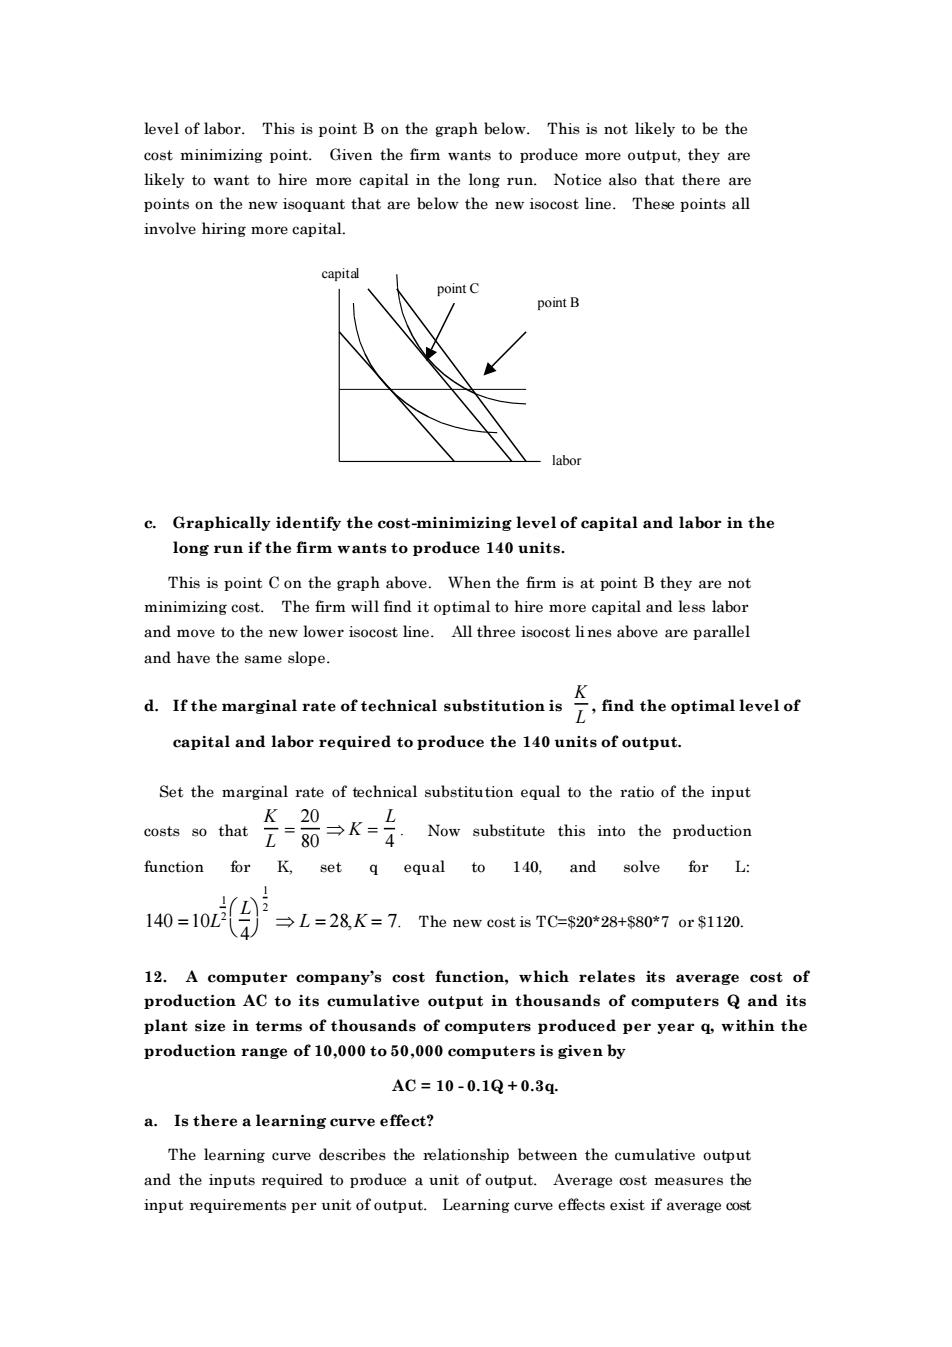
level of labor.This is point B on the graph below.This is not likely to be the cost minimizing point. Given thefirm wante to produce more ou,theyare likely to want to hire more capital in the long run.Notice also that there are points on the new isoquant that are below the new isocost line.These points all involve hiring more capital. oint B c.Graphically identify the cost-minimizing level of capital and labor in the long run if the firm wants to produce 140 units. This is point con the graph above.When the firm is at point b they are not minimizing cost.The firm will find it optimal to hire more capital and less labor and move to the new lower isocost line.All three isocost lines above are parallel and have the same slope. d.of technical ind the optimal levelof capital and labor required to produce the 140 units of output. Set the marginal rate of technical substitution equal to the ratio of the input Now substitute this into the production function for K,set q equal to 140.and solve for L: 1o=1o9 L=28K=7.The new cost is TC=$20*28+S80*7 or $1120 plant size in terms of thousands of computers produced per year q.within the production range of 10,000 to 50,000 computers is given by AC=10-0.1Q+0.3q. a.Is there a learning curve effect? The learning curve describes the relationship between the cumulative outputlevel of labor. This is point B on the graph below. This is not likely to be the cost minimizing point. Given the firm wants to produce more output, they are likely to want to hire more capital in the long run. Notice also that there are points on the new isoquant that are below the new isocost line. These points all involve hiring more capital. capit al labor point B point C c. Graphically identify the cost-minimizing level of capital and labor in the long run if the firm wants to produce 140 units. This is point C on the graph above. When the firm is at point B they are not minimizing cost. The firm will find it optimal to hire more capital and less labor and move to the new lower isocost line. All three isocost lines above are parallel and have the same slope. d. If the marginal rate of technical substitution is K L , find the optimal level of capital and labor required to produce the 140 units of output. Set the marginal rate of technical substitution equal to the ratio of the input costs so that K L = 20 80 K = L 4 . Now substitute this into the production function for K, set q equal to 140, and solve for L: 140 =10L 1 2 L 4 1 2 L = 28,K = 7. The new cost is TC=$20*28+$80*7 or $1120. 12. A computer company’s cost function, which relates its average cost of production AC to its cumulative output in thousands of computers Q and its plant size in terms of thousands of computers produced per year q, within the production range of 10,000 to 50,000 computers is given by AC = 10 - 0.1Q + 0.3q. a. Is there a learning curve effect? The learning curve describes the relationship between the cumulative output and the inputs required to produce a unit of output. Average cost measures the input requirements per unit of output. Learning curve effects exist if average cost