正在加载图片...
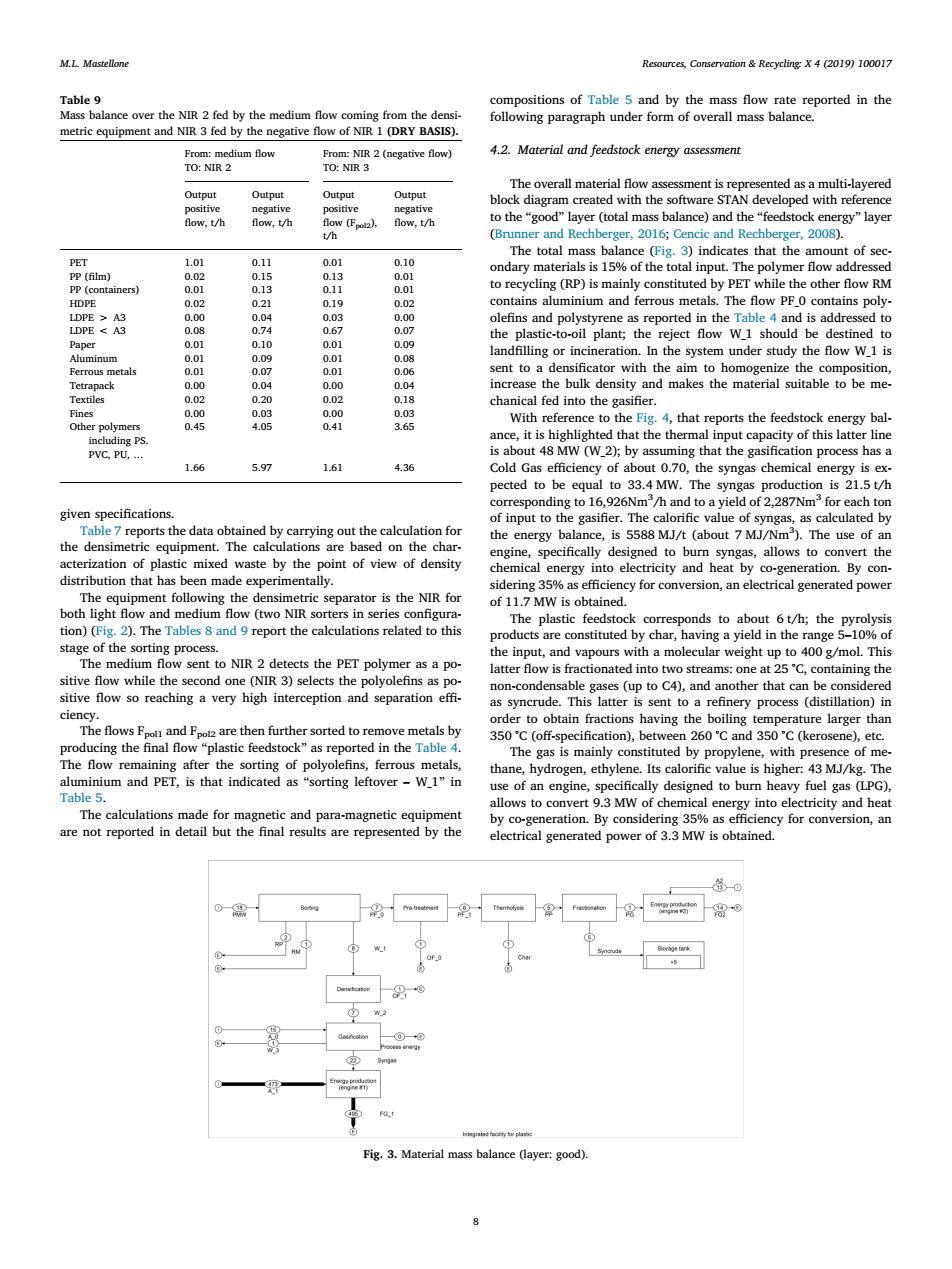
M.L Mastellone Resources,Conservation Recycling:X 4(2019)100017 Table 9 compositions of Table 5 and by the mass flow rate reported in the Mass balance over the NIR 2 fed by the medium flow coming from the densi- following paragraph under form of overall mass balance. metric equipment and NIR 3 fed by the negative flow of NIR 1 (DRY BASIS). From:medium flow From:NIR 2 (negative flow) 4.2.Material and feedstock energy assessment TO:NIR 2 TO:NIR 3 The overall material flow assessment is represented as a multi-layered Output Output Output Output positive negative positive negative block diagram created with the software STAN developed with reference flow,t/h flow,t/h flow (Fpo2), flow,t/h to the"good"layer(total mass balance)and the"feedstock energy"layer t (Brunner and Rechberger,2016;Cencic and Rechberger,2008). The total mass balance (Fig.3)indicates that the amount of sec- PET 1.01 0.11 0.01 0.10 PP(film) ondary materials is 15%of the total input.The polymer flow addressed 0.02 0.15 0.13 0.01 PP(containers) 0.01 0.13 0.11 0.01 to recycling (RP)is mainly constituted by PET while the other flow RM HDPE 0.02 0.21 0.19 0.02 contains aluminium and ferrous metals.The flow PFO contains poly- LDPE >A3 0.00 0.04 0.03 0.00 olefins and polystyrene as reported in the Table 4 and is addressed to LDPE A3 0.08 0.74 0.67 0.07 the plastic-to-oil plant;the reject flow W1 should be destined to Paper 0.01 0.10 0.01 0.09 Aluminum 0.01 0.09 0.01 0.08 landfilling or incineration.In the system under study the flow W_1 is Ferrous metals 0.01 0.07 0.01 0.06 sent to a densificator with the aim to homogenize the composition, Tetrapack 0.00 0.04 0.00 0.04 increase the bulk density and makes the material suitable to be me- Textiles 0.02 0.20 0.02 0.18 chanical fed into the gasifier. Fines 0.00 0.03 0.00 0.03 Other polymers 0.45 4.05 0.41 3.65 With reference to the Fig.4,that reports the feedstock energy bal- including PS. ance,it is highlighted that the thermal input capacity of this latter line PVC,PU,... is about 48 MW (W2);by assuming that the gasification process has a 1.66 5.97 1.61 4.36 Cold Gas efficiency of about 0.70,the syngas chemical energy is ex- pected to be equal to 33.4 MW.The syngas production is 21.5 t/h corresponding to 16,926Nm/h and to a yield of 2,287Nm for each ton given specifications. of input to the gasifier.The calorific value of syngas,as calculated by Table 7 reports the data obtained by carrying out the calculation for the energy balance,is 5588 MJ/t (about 7 MJ/Nm3).The use of an the densimetric equipment.The calculations are based on the char- engine,specifically designed to burn syngas,allows to convert the acterization of plastic mixed waste by the point of view of density chemical energy into electricity and heat by co-generation.By con distribution that has been made experimentally. sidering 35%as efficiency for conversion,an electrical generated power The equipment following the densimetric separator is the NIR for of 11.7 MW is obtained. both light flow and medium flow (two NIR sorters in series configura- The plastic feedstock corresponds to about 6t/h;the pyrolysis tion)(Fig.2).The Tables 8 and 9 report the calculations related to this products are constituted by char,having a yield in the range 5-10%of stage of the sorting process. the input,and vapours with a molecular weight up to 400 g/mol.This The medium flow sent to NIR 2 detects the PET polymer as a po- latter flow is fractionated into two streams:one at 25'C,containing the sitive flow while the second one (NIR 3)selects the polyolefins as po- non-condensable gases (up to C4),and another that can be considered sitive flow so reaching a very high interception and separation effi- as syncrude.This latter is sent to a refinery process (distillation)in ciency. order to obtain fractions having the boiling temperature larger than The flows Fpon and Fpo2 are then further sorted to remove metals by 350C (off-specification),between 260'C and 350C (kerosene),etc. producing the final flow "plastic feedstock"as reported in the Table 4. The gas is mainly constituted by propylene,with presence of me- The flow remaining after the sorting of polyolefins,ferrous metals, thane,hydrogen,ethylene.Its calorific value is higher:43 MJ/kg.The aluminium and PET,is that indicated as"sorting leftover-W_1"in use of an engine,specifically designed to burn heavy fuel gas (LPG), Table 5. allows to convert 9.3 MW of chemical energy into electricity and heat The calculations made for magnetic and para-magnetic equipment by co-generation.By considering 35%as efficiency for conversion,an are not reported in detail but the final results are represented by the electrical generated power of 3.3 MW is obtained. Fig.3.Material mass balance (layer:good). 8given specifications. Table 7 reports the data obtained by carrying out the calculation for the densimetric equipment. The calculations are based on the characterization of plastic mixed waste by the point of view of density distribution that has been made experimentally. The equipment following the densimetric separator is the NIR for both light flow and medium flow (two NIR sorters in series configuration) (Fig. 2). The Tables 8 and 9 report the calculations related to this stage of the sorting process. The medium flow sent to NIR 2 detects the PET polymer as a positive flow while the second one (NIR 3) selects the polyolefins as positive flow so reaching a very high interception and separation efficiency. The flows Fpol1 and Fpol2 are then further sorted to remove metals by producing the final flow “plastic feedstock” as reported in the Table 4. The flow remaining after the sorting of polyolefins, ferrous metals, aluminium and PET, is that indicated as “sorting leftover – W_1” in Table 5. The calculations made for magnetic and para-magnetic equipment are not reported in detail but the final results are represented by the compositions of Table 5 and by the mass flow rate reported in the following paragraph under form of overall mass balance. 4.2. Material and feedstock energy assessment The overall material flow assessment is represented as a multi-layered block diagram created with the software STAN developed with reference to the “good” layer (total mass balance) and the “feedstock energy” layer (Brunner and Rechberger, 2016; Cencic and Rechberger, 2008). The total mass balance (Fig. 3) indicates that the amount of secondary materials is 15% of the total input. The polymer flow addressed to recycling (RP) is mainly constituted by PET while the other flow RM contains aluminium and ferrous metals. The flow PF_0 contains polyolefins and polystyrene as reported in the Table 4 and is addressed to the plastic-to-oil plant; the reject flow W_1 should be destined to landfilling or incineration. In the system under study the flow W_1 is sent to a densificator with the aim to homogenize the composition, increase the bulk density and makes the material suitable to be mechanical fed into the gasifier. With reference to the Fig. 4, that reports the feedstock energy balance, it is highlighted that the thermal input capacity of this latter line is about 48 MW (W_2); by assuming that the gasification process has a Cold Gas efficiency of about 0.70, the syngas chemical energy is expected to be equal to 33.4 MW. The syngas production is 21.5 t/h corresponding to 16,926Nm3 /h and to a yield of 2,287Nm3 for each ton of input to the gasifier. The calorific value of syngas, as calculated by the energy balance, is 5588 MJ/t (about 7 MJ/Nm3 ). The use of an engine, specifically designed to burn syngas, allows to convert the chemical energy into electricity and heat by co-generation. By considering 35% as efficiency for conversion, an electrical generated power of 11.7 MW is obtained. The plastic feedstock corresponds to about 6 t/h; the pyrolysis products are constituted by char, having a yield in the range 5–10% of the input, and vapours with a molecular weight up to 400 g/mol. This latter flow is fractionated into two streams: one at 25 °C, containing the non-condensable gases (up to C4), and another that can be considered as syncrude. This latter is sent to a refinery process (distillation) in order to obtain fractions having the boiling temperature larger than 350 °C (off-specification), between 260 °C and 350 °C (kerosene), etc. The gas is mainly constituted by propylene, with presence of methane, hydrogen, ethylene. Its calorific value is higher: 43 MJ/kg. The use of an engine, specifically designed to burn heavy fuel gas (LPG), allows to convert 9.3 MW of chemical energy into electricity and heat by co-generation. By considering 35% as efficiency for conversion, an electrical generated power of 3.3 MW is obtained. Fig. 3. Material mass balance (layer: good). Table 9 Mass balance over the NIR 2 fed by the medium flow coming from the densimetric equipment and NIR 3 fed by the negative flow of NIR 1 (DRY BASIS). From: medium flow TO: NIR 2 From: NIR 2 (negative flow) TO: NIR 3 Output positive flow, t/h Output negative flow, t/h Output positive flow (Fpol2), t/h Output negative flow, t/h PET 1.01 0.11 0.01 0.10 PP (film) 0.02 0.15 0.13 0.01 PP (containers) 0.01 0.13 0.11 0.01 HDPE 0.02 0.21 0.19 0.02 LDPE > A3 0.00 0.04 0.03 0.00 LDPE < A3 0.08 0.74 0.67 0.07 Paper 0.01 0.10 0.01 0.09 Aluminum 0.01 0.09 0.01 0.08 Ferrous metals 0.01 0.07 0.01 0.06 Tetrapack 0.00 0.04 0.00 0.04 Textiles 0.02 0.20 0.02 0.18 Fines 0.00 0.03 0.00 0.03 Other polymers including PS. PVC, PU, … 0.45 4.05 0.41 3.65 1.66 5.97 1.61 4.36 M.L. Mastellone Resources, Conservation & Recycling: X 4 (2019) 100017 8