正在加载图片...

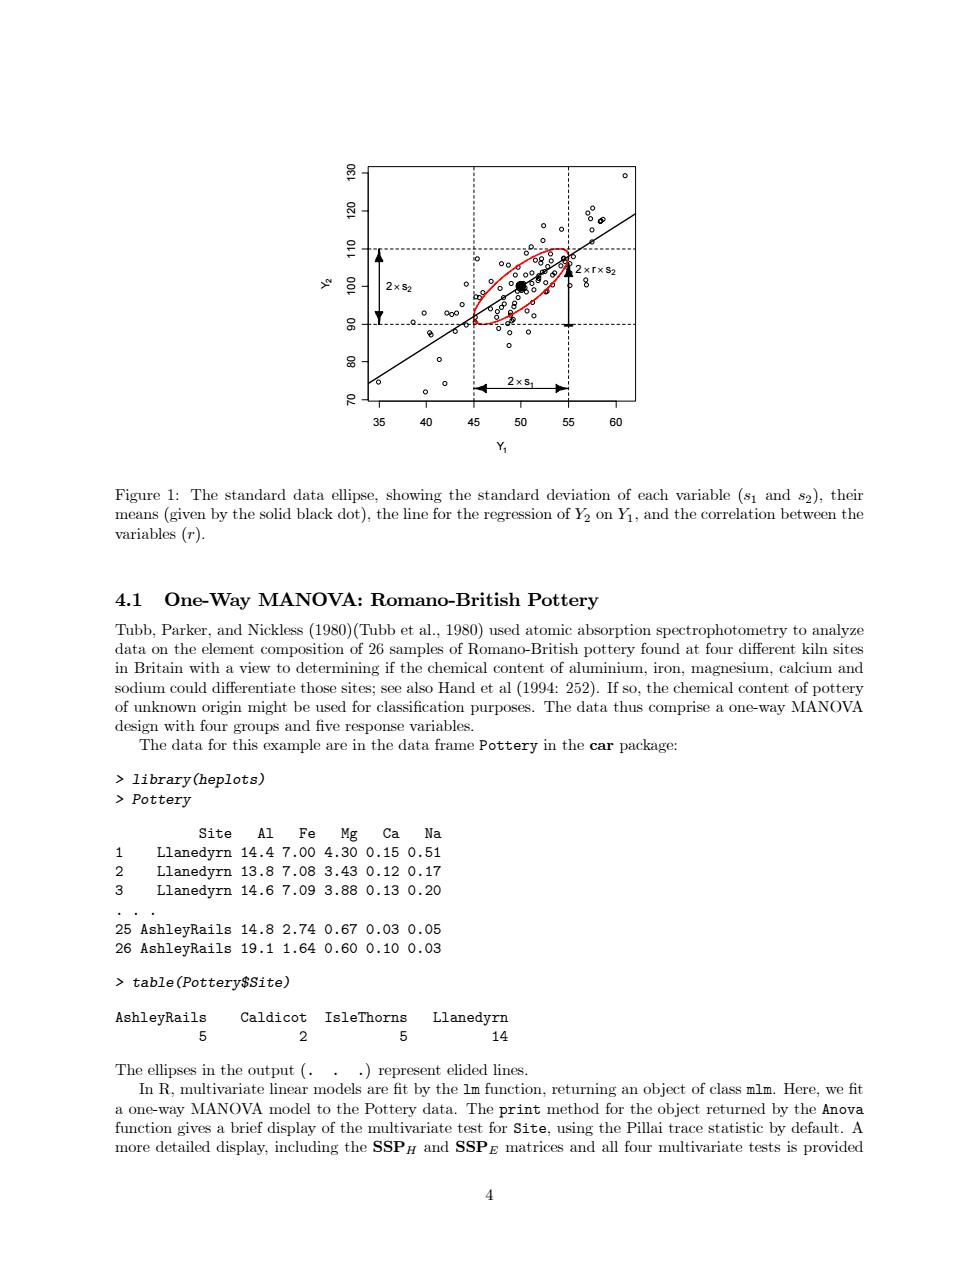
98 60 2×「×s2 2×S2 8 99 品 0 2×s1 40 50 55 60 Y Figure 1:The standard data ellipse,showing the standard deviation of each variable (s1 and s2),their means(given by the solid black dot),the line for the regression of Y2 on Y1,and the correlation between the variables (r). 4.1 One-Way MANOVA:Romano-British Pottery Tubb,Parker,and Nickless(1980)(Tubb et al.,1980)used atomic absorption spectrophotometry to analyze data on the element composition of 26 samples of Romano-British pottery found at four different kiln sites in Britain with a view to determining if the chemical content of aluminium,iron,magnesium,calcium and sodium could differentiate those sites:see also Hand et al (1994:252).If so.the chemical content of pottery of unknown origin might be used for classification purposes.The data thus comprise a one-way MANOVA design with four groups and five response variables. The data for this example are in the data frame Pottery in the car package: library(heplots) Pottery Site Al Fe Mg Ca Na 1 L1 anedyrn14.47.004.300.150.51 2 L1 anedyrn13.87.083.430.120.17 3 L1 anedyrn14.67.093.880.130.20 25Ash1 eyRai1s14.82.740.670.030.05 26Ash1 eyRai1s19.11.640.600.100.03 table(Pottery$site) AshleyRails Caldicot IsleThorns Llanedyrn 5 2 6 14 The ellipses in the output (...)represent elided lines. In R.multivariate linear models are fit by the Im function.returning an object of class mlm.Here,we fit a one-way MANOVA model to the Pottery data.The print method for the object returned by the Anova function gives a brief display of the multivariate test for Site,using the Pillai trace statistic by default.A more detailed display,including the SSP and SSPE matrices and all four multivariate tests is provided35 40 45 50 55 60 70 80 90 100 110 120 130 Y1 Y2 2 × s1 2× s2 2 × r × s2 - Figure 1: The standard data ellipse, showing the standard deviation of each variable (s1 and s2), their means (given by the solid black dot), the line for the regression of Y2 on Y1, and the correlation between the variables (r). 4.1 One-Way MANOVA: Romano-British Pottery Tubb, Parker, and Nickless (1980)(Tubb et al., 1980) used atomic absorption spectrophotometry to analyze data on the element composition of 26 samples of Romano-British pottery found at four different kiln sites in Britain with a view to determining if the chemical content of aluminium, iron, magnesium, calcium and sodium could differentiate those sites; see also Hand et al (1994: 252). If so, the chemical content of pottery of unknown origin might be used for classification purposes. The data thus comprise a one-way MANOVA design with four groups and five response variables. The data for this example are in the data frame Pottery in the car package: > library(heplots) > Pottery Site Al Fe Mg Ca Na 1 Llanedyrn 14.4 7.00 4.30 0.15 0.51 2 Llanedyrn 13.8 7.08 3.43 0.12 0.17 3 Llanedyrn 14.6 7.09 3.88 0.13 0.20 ... 25 AshleyRails 14.8 2.74 0.67 0.03 0.05 26 AshleyRails 19.1 1.64 0.60 0.10 0.03 > table(Pottery$Site) AshleyRails Caldicot IsleThorns Llanedyrn 5 2 5 14 The ellipses in the output (...) represent elided lines. In R, multivariate linear models are fit by the lm function, returning an object of class mlm. Here, we fit a one-way MANOVA model to the Pottery data. The print method for the object returned by the Anova function gives a brief display of the multivariate test for Site, using the Pillai trace statistic by default. A more detailed display, including the SSPH and SSPE matrices and all four multivariate tests is provided 4