正在加载图片...
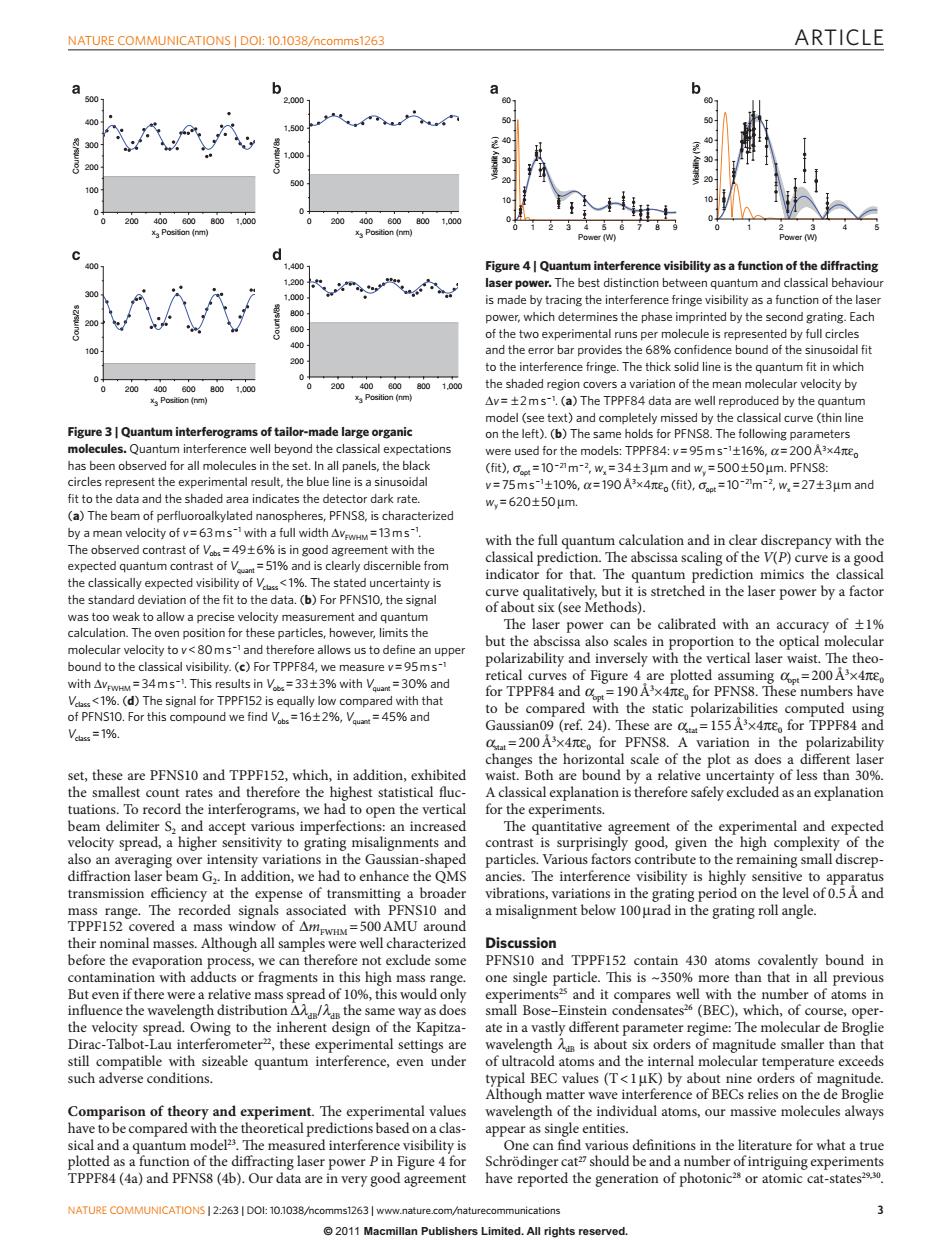
NATURE COMMUNICATIONS DOl:10.1038/ncomms1263 ARTICLE a a 00 2000 400 200 00 100 400 200 4006008001.000 xs Position (nm) 012.3456 on (nm d 1.400 Figure 4 |Quantum interference visibility as a function of the diffracting 1200 laser power.The best distinction between quantum and classical behaviour .000 is made by tracing the interference fringe visibility as a function of the laser 800 power,which determines the phase imprinted by the second grating.Each 00 of the two experimental runs per molecule is represented by full circles 400 and the error bar provides the 68%confidence bound of the sinusoidal fit 200 to the interference fringe.The thick solid line is the quantum fit in which 600 800 1.000 200 400800800 1.000 the shaded region covers a variation of the mean molecular velocity by Xs Position (nm) 气3 Position(nm) Av=+2ms-1.(a)The TPPF84 data are well reproduced by the quantum model (see text)and completely missed by the classical curve (thin line Figure 3 Quantum interferograms of tailor-made large organic on the left).(b)The same holds for PFNS8.The following parameters molecules.Quantum interference well beyond the classical expectations were used for the models:TPpF84:v=95ms-1±16%,a=200A3x4πeo has been observed for all molecules in the set.In all panels,the black (ft),ce=10-nm-2,w,=34±3μn and w,=500±50μm.PFNS8: circles represent the experimental result,the blue line is a sinusoidal v=75ms1±10%,a=190A3×4re。(ft),Got=10-m-2,w,=27±3μmand fit to the data and the shaded area indicates the detector dark rate. w,=620±50m. (a)The beam of perfluoroalkylated nanospheres,PFNS8,is characterized by a mean velocity of v=63mswith a full width AvwM=13ms. The observed contrast of Vobs=49+6%is in good agreement with the with the full quantum calculation and in clear discrepancy with the expected quantum contrast of Vm=51%and is clearly discernible from classical prediction.The abscissa scaling of the V(P)curve is a good the classically expected visibility of V1%.The stated uncertainty is indicator for that.The quantum prediction mimics the classical the standard deviation of the fit to the data.(b)For PFNS10,the signal curve qualitatively,but it is stretched in the laser power by a factor of about six (see Methods). was too weak to allow a precise velocity measurement and quantum calculation.The oven position for these particles,however,limits the The laser power can be calibrated with an accuracy of1% but the abscissa also scales in proportion to the optical molecular molecular velocity to v<80ms-and therefore allows us to define an upper bound to the classical visibility.(c)For TPPF84,we measure v=95ms- polarizability and inversely with the vertical laser waist.The theo- with AvEwHM=34ms-1.This results in V=33+3%with V=30%and retical curves of Figure 4 are plotted assumingp=200A3x4 V<1%.(d)The signal for TPPF152 is equally low compared with that for TPPF84 and =190 A3x4nE for PFNS8.These numbers have of PFNS10.For this compound we find Vabs=16+2%,Vua=45%and to be compared with the static polarizabilities computed using Vss=1%. Gaussian09 (ref.24).These are=155A3x4rteo for TPPF84 and =200A3x4r for PFNS8.A variation in the polarizability changes the horizontal scale of the plot as does a different laser set,these are PFNS10 and TPPF152,which,in addition,exhibited waist.Both are bound by a relative uncertainty of less than 30%. the smallest count rates and therefore the highest statistical fluc- A classical explanation is therefore safely excluded as an explanation tuations.To record the interferograms,we had to open the vertical for the experiments. beam delimiter S,and accept various imperfections:an increased The quantitative agreement of the experimental and expected velocity spread,a higher sensitivity to grating misalignments and contrast is surprisingly good,given the high complexity of the also an averaging over intensity variations in the Gaussian-shaped particles.Various factors contribute to the remaining small discrep- diffraction laser beam G2.In addition,we had to enhance the QMS ancies.The interference visibility is highly sensitive to apparatus transmission efficiency at the expense of transmitting a broader vibrations,variations in the grating period on the level of 0.5A and mass range.The recorded signals associated with PFNS10 and a misalignment below 100urad in the grating roll angle. TPPF152 covered a mass window of AmwHM=500 AMU around their nominal masses.Although all samples were well characterized Discussion before the evaporation process,we can therefore not exclude some PFNS10 and TPPF152 contain 430 atoms covalently bound in contamination with adducts or fragments in this high mass range. one single particle.This is ~350%more than that in all previous But even if there were a relative mass spread of 10%,this would only experiments and it compares well with the number of atoms in influence the wavelength distribution A the same way as does small Bose-Einstein condensates26(BEC),which,of course,oper- the velocity spread.Owing to the inherent design of the Kapitza- ate in a vastly different parameter regime:The molecular de Broglie Dirac-Talbot-Lau interferometer2,these experimental settings are wavelength is about six orders of magnitude smaller than that still compatible with sizeable quantum interference,even under of ultracold atoms and the internal molecular temperature exceeds such adverse conditions. typical BEC values (T<1uK)by about nine orders of magnitude. Although matter wave interference of BECs relies on the de Broglie Comparison of theory and experiment.The experimental values wavelength of the individual atoms,our massive molecules always have to be compared with the theoretical predictions based on a clas- appear as single entities sical and a quantum model.The measured interference visibility is One can find various definitions in the literature for what a true plotted as a function of the diffracting laser power P in Figure 4 for Schrodinger cat2 should be and a number of intriguing experiments TPPF84(4a)and PFNS8(4b).Our data are in very good agreement have reported the generation of photonic?s or atomic cat-states290. NATURE COMMUNICATIONS 2:263 DOl:10.1038/ncomms1263 www.nature.com/naturecommunications 2011 Macmillan Publishers Limited.All rights reserved.ARTICLE nature communications | DOI: 10.1038/ncomms1263 nature communications | 2:263 | DOI: 10.1038/ncomms1263 | www.nature.com/naturecommunications © 2011 Macmillan Publishers Limited. All rights reserved. set, these are PFNS10 and TPPF152, which, in addition, exhibited the smallest count rates and therefore the highest statistical fluctuations. To record the interferograms, we had to open the vertical beam delimiter S2 and accept various imperfections: an increased velocity spread, a higher sensitivity to grating misalignments and also an averaging over intensity variations in the Gaussian-shaped diffraction laser beam G2. In addition, we had to enhance the QMS transmission efficiency at the expense of transmitting a broader mass range. The recorded signals associated with PFNS10 and TPPF152 covered a mass window of ∆mFWHM =500AMU around their nominal masses. Although all samples were well characterized before the evaporation process, we can therefore not exclude some contamination with adducts or fragments in this high mass range. But even if there were a relative mass spread of 10%, this would only influence the wavelength distribution ∆λdB/λdB the same way as does the velocity spread. Owing to the inherent design of the KapitzaDirac-Talbot-Lau interferometer22 , these experimental settings are still compatible with sizeable quantum interference, even under such adverse conditions. Comparison of theory and experiment. The experimental values have to be compared with the theoretical predictions based on a classical and a quantum model23 . The measured interference visibility is plotted as a function of the diffracting laser power P in Figure 4 for TPPF84 (4a) and PFNS8 (4b). Our data are in very good agreement with the full quantum calculation and in clear discrepancy with the classical prediction. The abscissa scaling of the V(P) curve is a good indicator for that. The quantum prediction mimics the classical curve qualitatively, but it is stretched in the laser power by a factor of about six (see Methods). The laser power can be calibrated with an accuracy of ±1% but the abscissa also scales in proportion to the optical molecular polarizability and inversely with the vertical laser waist. The theoretical curves of Figure 4 are plotted assuming αopt=200Å3 ×4πε0 for TPPF84 and αopt=190Å3 ×4πε0 for PFNS8. These numbers have to be compared with the static polarizabilities computed using Gaussian09 (ref. 24). These are αstat=155Å3 ×4πε0 for TPPF84 and αstat=200Å3 ×4πε0 for PFNS8. A variation in the polarizability changes the horizontal scale of the plot as does a different laser waist. Both are bound by a relative uncertainty of less than 30%. A classical explanation is therefore safely excluded as an explanation for the experiments. The quantitative agreement of the experimental and expected contrast is surprisingly good, given the high complexity of the particles. Various factors contribute to the remaining small discrepancies. The interference visibility is highly sensitive to apparatus vibrations, variations in the grating period on the level of 0.5Å and a misalignment below 100µrad in the grating roll angle. Discussion PFNS10 and TPPF152 contain 430 atoms covalently bound in one single particle. This is ~350% more than that in all previous experiments25 and it compares well with the number of atoms in small Bose–Einstein condensates26 (BEC), which, of course, operate in a vastly different parameter regime: The molecular de Broglie wavelength λdB is about six orders of magnitude smaller than that of ultracold atoms and the internal molecular temperature exceeds typical BEC values (T<1µK) by about nine orders of magnitude. Although matter wave interference of BECs relies on the de Broglie wavelength of the individual atoms, our massive molecules always appear as single entities. One can find various definitions in the literature for what a true Schrödinger cat27 should be and a number of intriguing experiments have reported the generation of photonic28 or atomic cat-states29,30. Counts/2s 0 200 400 600 800 1,000 1,200 1,400 Counts/8s 0 200 400 600 800 1,000 0 100 200 300 400 0 100 200 300 400 500 Counts/2s x3 Position (nm) 0 200 400 600 800 1,000 x3 Position (nm) 0 200 400 600 800 1,000 x3 Position (nm) 0 200 400 600 800 1,000 x3 Position (nm) 0 500 1,000 1,500 2,000 Counts/8s Figure 3 | Quantum interferograms of tailor-made large organic molecules. Quantum interference well beyond the classical expectations has been observed for all molecules in the set. In all panels, the black circles represent the experimental result, the blue line is a sinusoidal fit to the data and the shaded area indicates the detector dark rate. (a) The beam of perfluoroalkylated nanospheres, PFNS8, is characterized by a mean velocity of v=63ms−1 with a full width ∆vFWHM =13ms−1 . The observed contrast of Vobs=49±6% is in good agreement with the expected quantum contrast of Vquant=51% and is clearly discernible from the classically expected visibility of Vclass<1%. The stated uncertainty is the standard deviation of the fit to the data. (b) For PFNS10, the signal was too weak to allow a precise velocity measurement and quantum calculation. The oven position for these particles, however, limits the molecular velocity to v<80ms−1 and therefore allows us to define an upper bound to the classical visibility. (c) For TPPF84, we measure v=95ms−1 with ∆vFWHM =34ms−1 . This results in Vobs=33±3% with Vquant=30% and Vclass<1%. (d) The signal for TPPF152 is equally low compared with that of PFNS10. For this compound we find Vobs=16±2%, Vquant=45% and Vclass=1%. 0 1 2 3 4 5 6 7 8 9 0 10 20 30 40 50 60 Visibility (%) Power (W) 0 1 2 3 4 5 0 10 20 30 40 50 60 Visibility (%) Power (W) Figure 4 | Quantum interference visibility as a function of the diffracting laser power. The best distinction between quantum and classical behaviour is made by tracing the interference fringe visibility as a function of the laser power, which determines the phase imprinted by the second grating. Each of the two experimental runs per molecule is represented by full circles and the error bar provides the 68% confidence bound of the sinusoidal fit to the interference fringe. The thick solid line is the quantum fit in which the shaded region covers a variation of the mean molecular velocity by ∆v= ±2ms−1 . (a) The TPPF84 data are well reproduced by the quantum model (see text) and completely missed by the classical curve (thin line on the left). (b) The same holds for PFNS8. The following parameters were used for the models: TPPF84: v=95ms−1 ±16%, α=200Å3 ×4πε0 (fit), σopt=10−21m−2 , wx=34±3µm and wy=500±50µm. PFNS8: v=75ms−1 ±10%, α=190Å3 ×4πε0 (fit), σopt=10−21m−2 , wx=27±3µm and wy=620±50µm