正在加载图片...

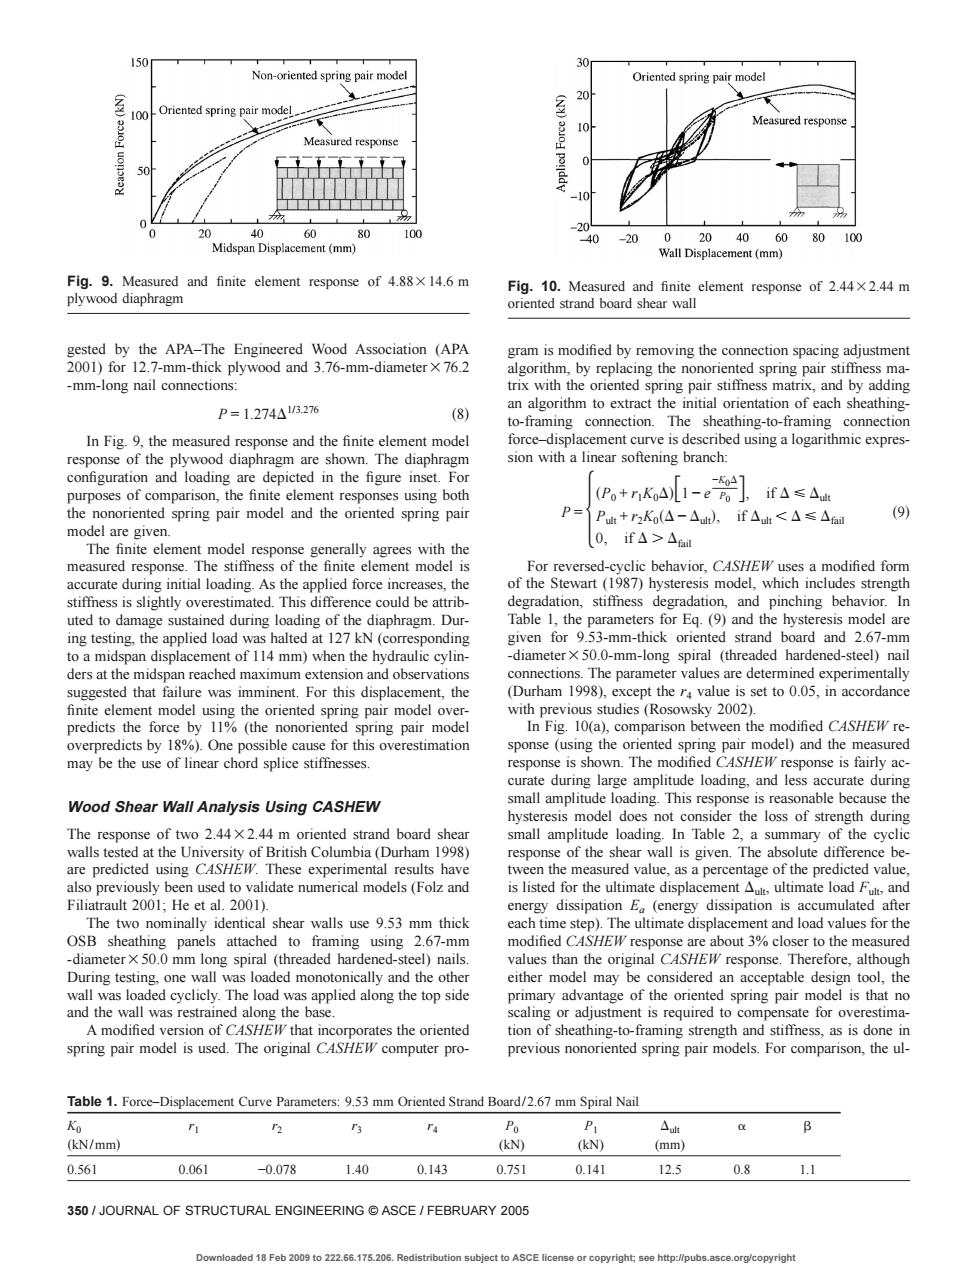
150 model Measured respo 40 -20 40 80 Fig.9.Measured and finite element response of 4.88x14.6 m 10.Me plywood diaphragm d Wood Asso -mm-long nail connections P=1.274A526 to-framing connection The sheathing-to-framing connection lin ed using a logarithmic expres e elem P+rKA1-e元].ifAs△ P+r,K(△-△)if△<△≤△6 (9) 0.if△>△ ic heha ing testing.the applied load a halted t( onding 50-mm-ongspiral (threaded hardened-stee) (Durham9).except thealue is set ny2002 overpredicts by 1%).One sible cause for this overestimation may be the use of linear chord splice stiffnesses. response is shown y a Wood Shear Wall Analysis Using CASHEW ponse is reasonable be e the The 5eft0244×244m of Br m1998) wall is given.The absolute differ nce be sing CA +A energy dissipation E (energy dissipation is accumulated afte each t Duameter500m long oaded mono either moc I may b naccepta and the wall was restrained ong the bap sate for ov Table 1.Force-Displacement Curve Parameters:9.53 mm Oriented Strand Board/2.67 mm Spiral Nail B (kN/mm) 0.561 0.061 -0.078 1.40 0.143 0.751 0.14 25 0.8 350/JOURNAL OF STRUCTURAL ENGINEERING ASCE/FEBRUARY 2005 aded 18 Fob 2009 to 222.66.175.206.Redistribu n subjoct to ASCE o.org/copyright gested by the APA–The Engineered Wood Association (APA 2001) for 12.7-mm-thick plywood and 3.76-mm-diameter376.2 -mm-long nail connections: P = 1.274D1/3.276 s8d In Fig. 9, the measured response and the finite element model response of the plywood diaphragm are shown. The diaphragm configuration and loading are depicted in the figure inset. For purposes of comparison, the finite element responses using both the nonoriented spring pair model and the oriented spring pair model are given. The finite element model response generally agrees with the measured response. The stiffness of the finite element model is accurate during initial loading. As the applied force increases, the stiffness is slightly overestimated. This difference could be attributed to damage sustained during loading of the diaphragm. During testing, the applied load was halted at 127 kN (corresponding to a midspan displacement of 114 mm) when the hydraulic cylinders at the midspan reached maximum extension and observations suggested that failure was imminent. For this displacement, the finite element model using the oriented spring pair model overpredicts the force by 11% (the nonoriented spring pair model overpredicts by 18%). One possible cause for this overestimation may be the use of linear chord splice stiffnesses. Wood Shear Wall Analysis Using CASHEW The response of two 2.4432.44 m oriented strand board shear walls tested at the University of British Columbia (Durham 1998) are predicted using CASHEW. These experimental results have also previously been used to validate numerical models (Folz and Filiatrault 2001; He et al. 2001). The two nominally identical shear walls use 9.53 mm thick OSB sheathing panels attached to framing using 2.67-mm -diameter350.0 mm long spiral (threaded hardened-steel) nails. During testing, one wall was loaded monotonically and the other wall was loaded cyclicly. The load was applied along the top side and the wall was restrained along the base. A modified version of CASHEW that incorporates the oriented spring pair model is used. The original CASHEW computer program is modified by removing the connection spacing adjustment algorithm, by replacing the nonoriented spring pair stiffness matrix with the oriented spring pair stiffness matrix, and by adding an algorithm to extract the initial orientation of each sheathingto-framing connection. The sheathing-to-framing connection force–displacement curve is described using a logarithmic expression with a linear softening branch: P = 5 sP0 + r1K0Ddf1 − e −K0D P0 g, if DøDult Pult + r2K0sD − Dultd, if Dult ,DøDfail 0, if D.Dfail 6 s9d For reversed-cyclic behavior, CASHEW uses a modified form of the Stewart (1987) hysteresis model, which includes strength degradation, stiffness degradation, and pinching behavior. In Table 1, the parameters for Eq. (9) and the hysteresis model are given for 9.53-mm-thick oriented strand board and 2.67-mm -diameter350.0-mm-long spiral (threaded hardened-steel) nail connections. The parameter values are determined experimentally (Durham 1998), except the r4 value is set to 0.05, in accordance with previous studies (Rosowsky 2002). In Fig. 10(a), comparison between the modified CASHEW response (using the oriented spring pair model) and the measured response is shown. The modified CASHEW response is fairly accurate during large amplitude loading, and less accurate during small amplitude loading. This response is reasonable because the hysteresis model does not consider the loss of strength during small amplitude loading. In Table 2, a summary of the cyclic response of the shear wall is given. The absolute difference between the measured value, as a percentage of the predicted value, is listed for the ultimate displacement Dult, ultimate load Fult, and energy dissipation Ea (energy dissipation is accumulated after each time step). The ultimate displacement and load values for the modified CASHEW response are about 3% closer to the measured values than the original CASHEW response. Therefore, although either model may be considered an acceptable design tool, the primary advantage of the oriented spring pair model is that no scaling or adjustment is required to compensate for overestimation of sheathing-to-framing strength and stiffness, as is done in previous nonoriented spring pair models. For comparison, the ulFig. 9. Measured and finite element response of 4.88314.6 m plywood diaphragm Table 1. Force–Displacement Curve Parameters: 9.53 mm Oriented Strand Board/2.67 mm Spiral Nail K0 r1 r2 r3 r4 P0 P1 Dult a b skN/mmd (kN) (kN) (mm) 0.561 0.061 −0.078 1.40 0.143 0.751 0.141 12.5 0.8 1.1 Fig. 10. Measured and finite element response of 2.4432.44 m oriented strand board shear wall 350 / JOURNAL OF STRUCTURAL ENGINEERING © ASCE / FEBRUARY 2005 Downloaded 18 Feb 2009 to 222.66.175.206. Redistribution subject to ASCE license or copyright; see http://pubs.asce.org/copyright