正在加载图片...
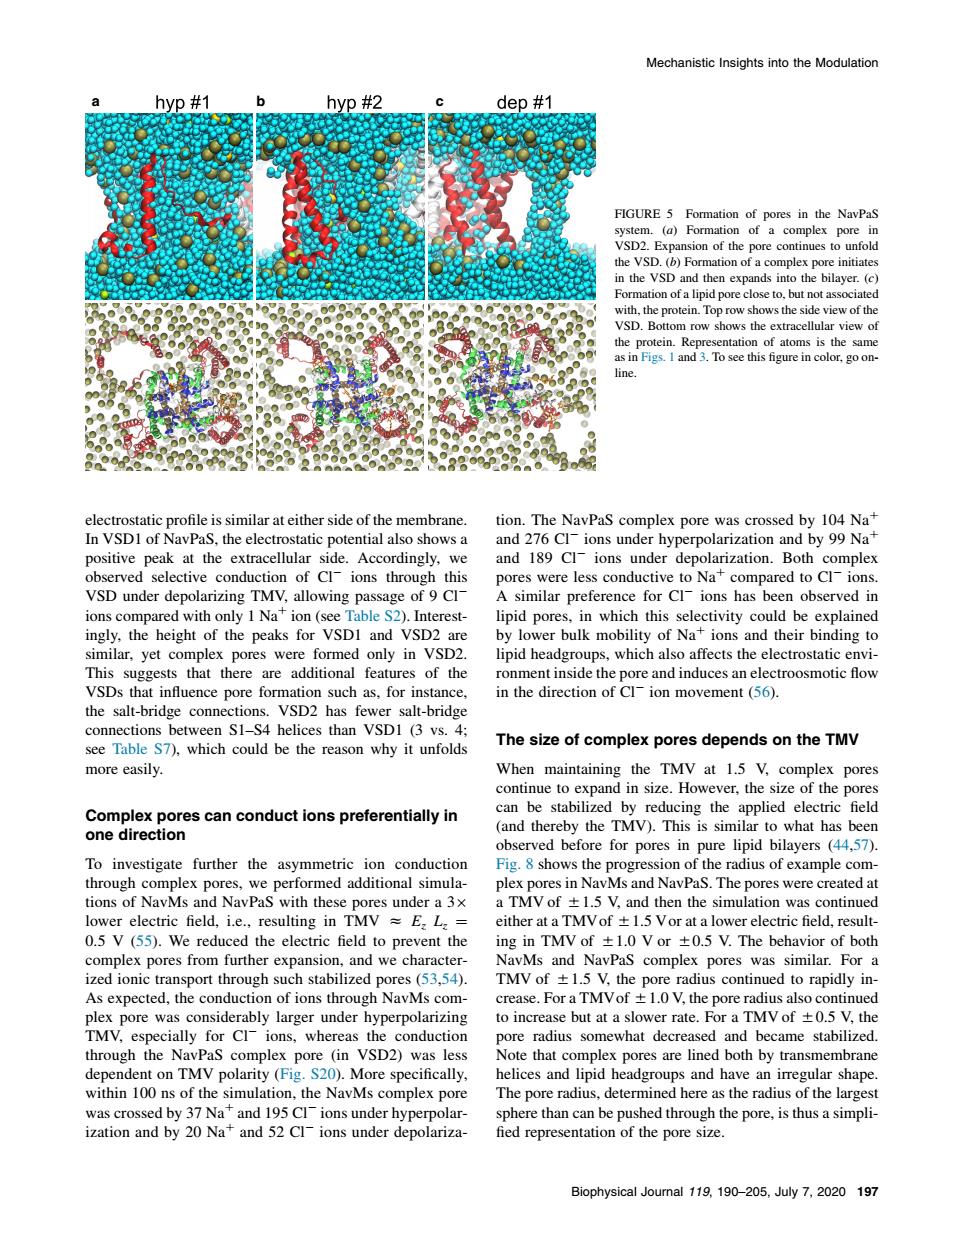
Mechanistic Insights into the Modulation FIGURE S Formation of ores in the NavPas (a)For of n of th d pore se o. om row sho ws the of t electrostatic profile is similar at either side of the membrane. tion.The NavPaS complex pore was crossed by 104 Na DI of NavPaS the ions under hyperpolarization and by 9 Na sitive pea f CI un ization. comple VSD under denolarizing tmy allowing passa A similar prefe ce for cl-ions has heen ohserved in ions compared with only I Naion(see Table S2).Interest- lipid pores.in which this selectivity could be explained yet comp pores wer only in which nects the ectrosltaicfoy VSDs that influence nore formation such as for instane in the direction of Clion movement (56). the salt-bridge connec salt-bridge The size of complex pores depends on the TM cou asily the 8gnascaneonauatleaspretereniayn Comiebabedicieheapietelectncieid (and th eby the TMV).This is simila to what has been for poro nlex n s in NavMs and NavPaS.The pores were eated at TMVof: at a TMV to prevent the 0 ized ionic transport through such stabilized po eg535 TMV of +15 V the As expected,the conduction of ions through NavMs com crease.For a TMVof1.0 V,the pore radius also pore w to incr but at a ugh thec ndent on TMV polarity (Fig.S20).More specifically helices and linid headgrouns and have an irregular shape within 100 ns of the simulation.the NavMs complex pore The pore radius.determined here as the radius of the largest sphere than can be pushed through the pore,is thus a simpli and 52 Cl ions under ied rep or the pore s12 Biophysical Journal 119.190-205.July 7.2020 197electrostatic profile is similar at either side of the membrane. In VSD1 of NavPaS, the electrostatic potential also shows a positive peak at the extracellular side. Accordingly, we observed selective conduction of Cl ions through this VSD under depolarizing TMV, allowing passage of 9 Cl ions compared with only 1 Naþ ion (see Table S2). Interestingly, the height of the peaks for VSD1 and VSD2 are similar, yet complex pores were formed only in VSD2. This suggests that there are additional features of the VSDs that influence pore formation such as, for instance, the salt-bridge connections. VSD2 has fewer salt-bridge connections between S1–S4 helices than VSD1 (3 vs. 4; see Table S7), which could be the reason why it unfolds more easily. Complex pores can conduct ions preferentially in one direction To investigate further the asymmetric ion conduction through complex pores, we performed additional simulations of NavMs and NavPaS with these pores under a 3 lower electric field, i.e., resulting in TMV z Ez Lz ¼ 0.5 V (55). We reduced the electric field to prevent the complex pores from further expansion, and we characterized ionic transport through such stabilized pores (53,54). As expected, the conduction of ions through NavMs complex pore was considerably larger under hyperpolarizing TMV, especially for Cl ions, whereas the conduction through the NavPaS complex pore (in VSD2) was less dependent on TMV polarity (Fig. S20). More specifically, within 100 ns of the simulation, the NavMs complex pore was crossed by 37 Naþ and 195 Cl ions under hyperpolarization and by 20 Naþ and 52 Cl ions under depolarization. The NavPaS complex pore was crossed by 104 Naþ and 276 Cl ions under hyperpolarization and by 99 Naþ and 189 Cl ions under depolarization. Both complex pores were less conductive to Naþ compared to Cl ions. A similar preference for Cl ions has been observed in lipid pores, in which this selectivity could be explained by lower bulk mobility of Naþ ions and their binding to lipid headgroups, which also affects the electrostatic environment inside the pore and induces an electroosmotic flow in the direction of Cl ion movement (56). The size of complex pores depends on the TMV When maintaining the TMV at 1.5 V, complex pores continue to expand in size. However, the size of the pores can be stabilized by reducing the applied electric field (and thereby the TMV). This is similar to what has been observed before for pores in pure lipid bilayers (44,57). Fig. 8 shows the progression of the radius of example complex pores in NavMs and NavPaS. The pores were created at a TMV of 51.5 V, and then the simulation was continued either at a TMV of 51.5 Vor at a lower electric field, resulting in TMV of 51.0 V or 50.5 V. The behavior of both NavMs and NavPaS complex pores was similar. For a TMV of 51.5 V, the pore radius continued to rapidly increase. For a TMVof 51.0 V, the pore radius also continued to increase but at a slower rate. For a TMV of 50.5 V, the pore radius somewhat decreased and became stabilized. Note that complex pores are lined both by transmembrane helices and lipid headgroups and have an irregular shape. The pore radius, determined here as the radius of the largest sphere than can be pushed through the pore, is thus a simpli- fied representation of the pore size. ab c FIGURE 5 Formation of pores in the NavPaS system. (a) Formation of a complex pore in VSD2. Expansion of the pore continues to unfold the VSD. (b) Formation of a complex pore initiates in the VSD and then expands into the bilayer. (c) Formation of a lipid pore close to, but not associated with, the protein. Top row shows the side view of the VSD. Bottom row shows the extracellular view of the protein. Representation of atoms is the same as in Figs. 1 and 3. To see this figure in color, go online. Mechanistic Insights into the Modulation Biophysical Journal 119, 190–205, July 7, 2020 197����������