正在加载图片...
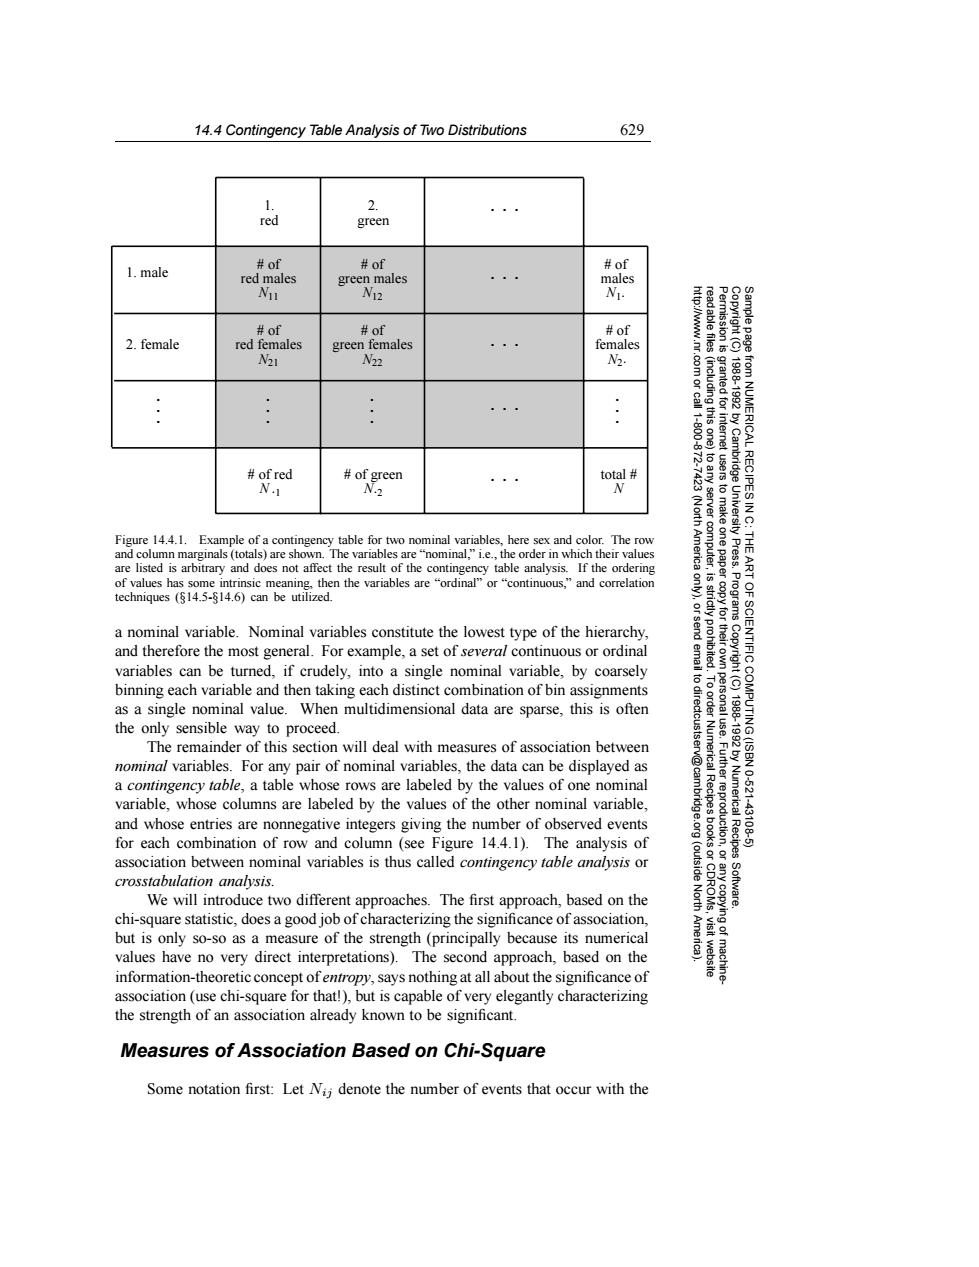
14.4 Contingency Table Analysis of Two Distributions 629 1. 2. red green 1.male #of #of #of red males green males males Nu N12 N1- #of #of #of 2.female red females green females females N21 N22 N2: ... #of red of green total NI (Nort server Figure 14.4.1.Example of a contingency table for two nominal variables,here sex and color.The row America computer, University Press. THE and column marginals (totals)are shown.The variables are"nominal,"i.e.,the order in which their values are listed is arbitrary and does not affect the result of the contingency table analysis.If the ordering of values has some intrinsic meaning,then the variables are "ordinal"or "continuous,"and correlation techniques ($14.5-814.6)can be utilized. 9 Progra a nominal variable.Nominal variables constitute the lowest type of the hierarchy, and therefore the most general.For example,a set of several continuous or ordinal variables can be turned.if crudely,into a single nominal variable,by coarsely a binning each variable and then taking each distinct combination of bin assignments as a single nominal value.When multidimensional data are sparse,this is often the only sensible way to proceed. OF SCIENTIFIC COMPUTING (ISBN The remainder of this section will deal with measures of association between 1888192 nominal variables.For any pair of nominal variables,the data can be displayed as a contingency table,a table whose rows are labeled by the values of one nominal 10621 variable,whose columns are labeled by the values of the other nominal variable, and whose entries are nonnegative integers giving the number of observed events FuurrgProglrion Numerical Recipes 43106 for each combination of row and column (see Figure 14.4.1).The analysis of association between nominal variables is thus called contingency table analysis or (outside crosstabulation analysis. We will introduce two different approaches.The first approach,based on the North Software. chi-square statistic,does a good job of characterizing the significance of association. but is only so-so as a measure of the strength(principally because its numerical values have no very direct interpretations).The second approach,based on the information-theoretic concept ofentropy,says nothing at all about the significance of association (use chi-square for that!)but is capable of very elegantly characterizing the strength of an association already known to be significant. Measures of Association Based on Chi-Square Some notation first:Let Ni;denote the number of events that occur with the14.4 Contingency Table Analysis of Two Distributions 629 Permission is granted for internet users to make one paper copy for their own personal use. Further reproduction, or any copyin Copyright (C) 1988-1992 by Cambridge University Press. Programs Copyright (C) 1988-1992 by Numerical Recipes Software. Sample page from NUMERICAL RECIPES IN C: THE ART OF SCIENTIFIC COMPUTING (ISBN 0-521-43108-5) g of machinereadable files (including this one) to any server computer, is strictly prohibited. To order Numerical Recipes books or CDROMs, visit website http://www.nr.com or call 1-800-872-7423 (North America only), or send email to directcustserv@cambridge.org (outside North America). 1. male 2. female . . . . . . . . . . . . . . . . . . . . . . . . 1. . . . red # of red males N11 # of red females N21 # of green females N22 # of green males N12 # of males N1⋅ # of females N2⋅ 2. green # of red N ⋅1 # of green N⋅2 total # N Figure 14.4.1. Example of a contingency table for two nominal variables, here sex and color. The row and column marginals (totals) are shown. The variables are “nominal,” i.e., the order in which their values are listed is arbitrary and does not affect the result of the contingency table analysis. If the ordering of values has some intrinsic meaning, then the variables are “ordinal” or “continuous,” and correlation techniques (§14.5-§14.6) can be utilized. a nominal variable. Nominal variables constitute the lowest type of the hierarchy, and therefore the most general. For example, a set of several continuous or ordinal variables can be turned, if crudely, into a single nominal variable, by coarsely binning each variable and then taking each distinct combination of bin assignments as a single nominal value. When multidimensional data are sparse, this is often the only sensible way to proceed. The remainder of this section will deal with measures of association between nominal variables. For any pair of nominal variables, the data can be displayed as a contingency table, a table whose rows are labeled by the values of one nominal variable, whose columns are labeled by the values of the other nominal variable, and whose entries are nonnegative integers giving the number of observed events for each combination of row and column (see Figure 14.4.1). The analysis of association between nominal variables is thus called contingency table analysis or crosstabulation analysis. We will introduce two different approaches. The first approach, based on the chi-square statistic, does a good job of characterizing the significance of association, but is only so-so as a measure of the strength (principally because its numerical values have no very direct interpretations). The second approach, based on the information-theoretic concept of entropy, says nothing at all about the significance of association (use chi-square for that!), but is capable of very elegantly characterizing the strength of an association already known to be significant. Measures of Association Based on Chi-Square Some notation first: Let Nij denote the number of events that occur with the