正在加载图片...

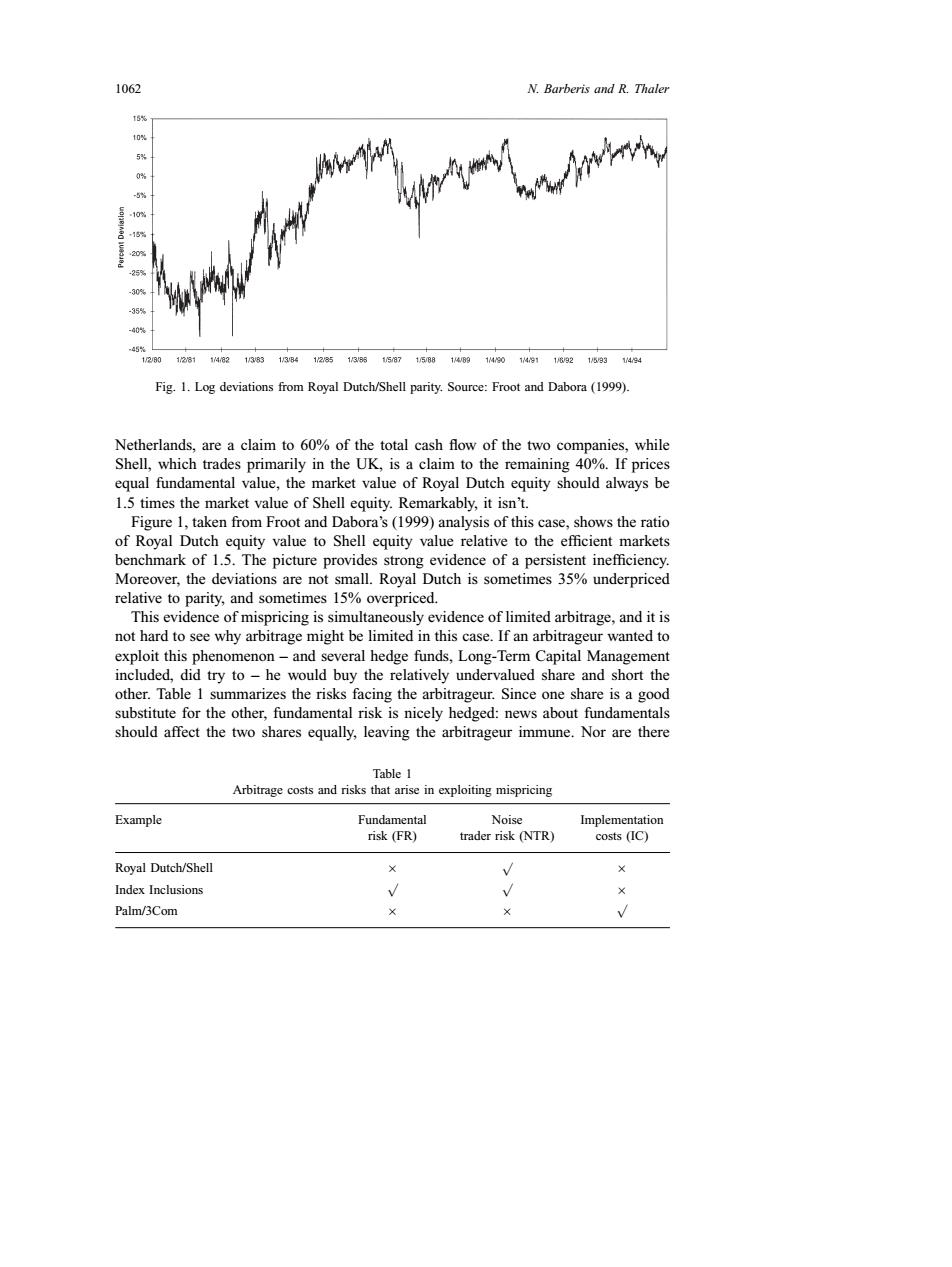
1062 N.Barberis and R.Thaler 5% 25 30% 35% 40 45 1/280 128114,82138313B4128513951587158814B914301491183215931494 Fig.1.Log deviations from Royal Dutch/Shell parity.Source:Froot and Dabora (1999). Netherlands,are a claim to 60%of the total cash flow of the two companies,while Shell,which trades primarily in the UK,is a claim to the remaining 40%.If prices equal fundamental value,the market value of Royal Dutch equity should always be 1.5 times the market value of Shell equity.Remarkably,it isn't. Figure 1,taken from Froot and Dabora's (1999)analysis of this case,shows the ratio of Royal Dutch equity value to Shell equity value relative to the efficient markets benchmark of 1.5.The picture provides strong evidence of a persistent inefficiency. Moreover,the deviations are not small.Royal Dutch is sometimes 35%underpriced relative to parity,and sometimes 15%overpriced. This evidence of mispricing is simultaneously evidence of limited arbitrage,and it is not hard to see why arbitrage might be limited in this case.If an arbitrageur wanted to exploit this phenomenon-and several hedge funds,Long-Term Capital Management included,did try to-he would buy the relatively undervalued share and short the other.Table 1 summarizes the risks facing the arbitrageur.Since one share is a good substitute for the other,fundamental risk is nicely hedged:news about fundamentals should affect the two shares equally,leaving the arbitrageur immune.Nor are there Table 1 Arbitrage costs and risks that arise in exploiting mispricing Example Fundamental Noise Implementation risk(FR) trader risk (NTR) costs (IC) Royal Dutch/Shell × Index Inclusions V Palm/3Com1062 N. Barberis and R. Thaler Fig. 1. Log deviations from Royal Dutch/Shell parity. Source: Froot and Dabora (1999). Netherlands, are a claim to 60% of the total cash flow of the two companies, while Shell, which trades primarily in the UK, is a claim to the remaining 40%. If prices equal fundamental value, the market value of Royal Dutch equity should always be 1.5 times the market value of Shell equity. Remarkably, it isn’t. Figure 1, taken from Froot and Dabora’s (1999) analysis of this case, shows the ratio of Royal Dutch equity value to Shell equity value relative to the efficient markets benchmark of 1.5. The picture provides strong evidence of a persistent inefficiency. Moreover, the deviations are not small. Royal Dutch is sometimes 35% underpriced relative to parity, and sometimes 15% overpriced. This evidence of mispricing is simultaneously evidence of limited arbitrage, and it is not hard to see why arbitrage might be limited in this case. If an arbitrageur wanted to exploit this phenomenon – and several hedge funds, Long-Term Capital Management included, did try to – he would buy the relatively undervalued share and short the other. Table 1 summarizes the risks facing the arbitrageur. Since one share is a good substitute for the other, fundamental risk is nicely hedged: news about fundamentals should affect the two shares equally, leaving the arbitrageur immune. Nor are there Table 1 Arbitrage costs and risks that arise in exploiting mispricing Example Fundamental risk (FR) Noise trader risk (NTR) Implementation costs (IC) Royal Dutch/Shell × √ × Index Inclusions √ √ × Palm/3Com × × √