正在加载图片...
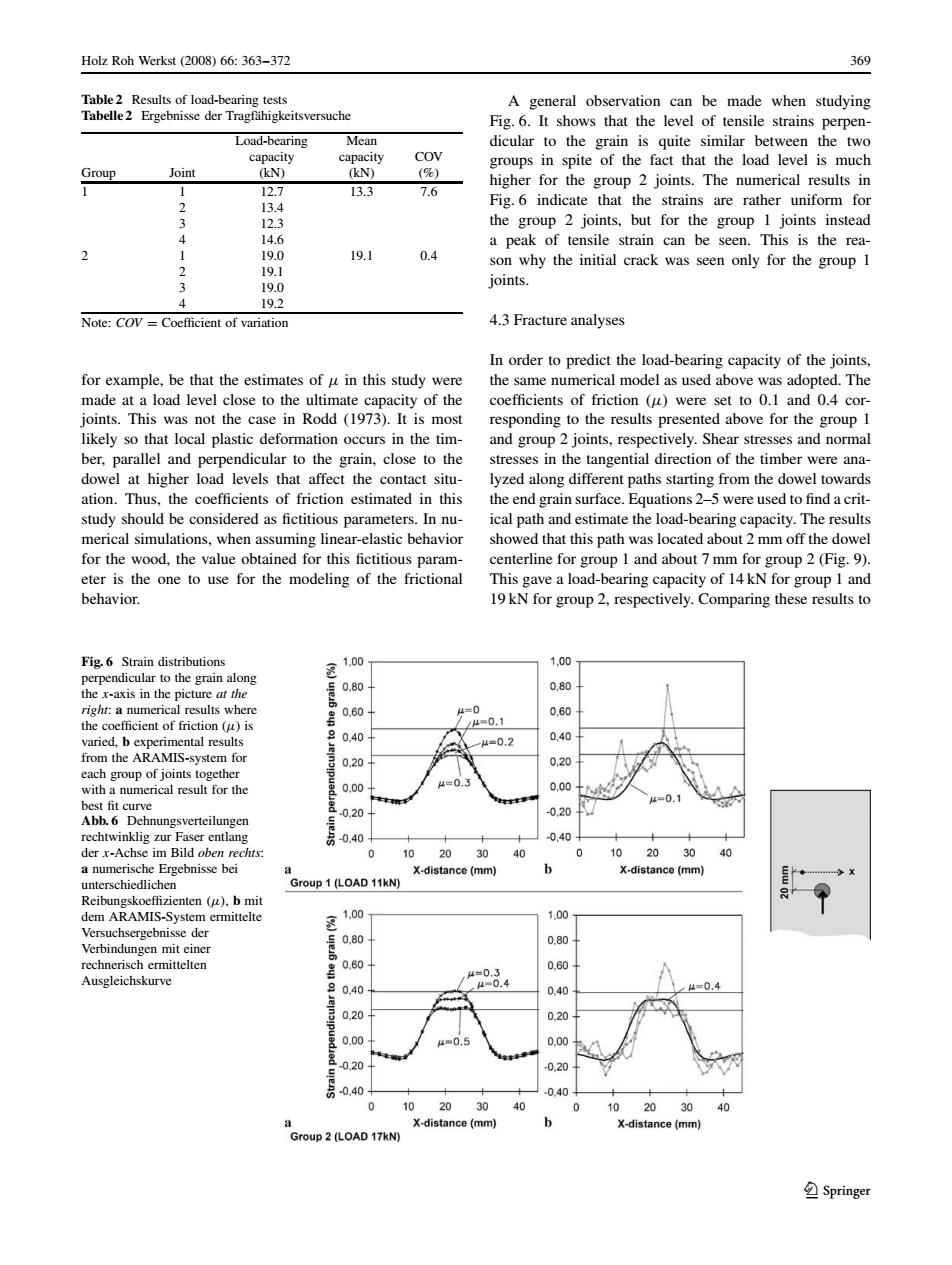
Holz Roh Werk过(2008)66:363-372 369 Load-bearing Mean dicular to the grain is quite similar between the two groups in spite of the fact that the load level is much loint 133 7.6 higher for the group 2 joints.The numerical results in 1g.6 indicate that the strains are rather uniform for the group but for the group 99 19.1 0.4 why joint Note:COV=Coefficient of variation 4.3 Fracture analyses s of in this study as us joints.This was not the case in Rodd (1973).It is most the results presented above for the group 1 likely so that local plastic deformation occurs in the tim- and group 2 joints,respectively.Shear stresses and normal ber.parallel and perpendicular to the grain,close to the stresses in the tangential direction of the timber were ana- dowel at higher load levels that affect the contact s of friction estimate th were merical simulation for the wood,the value obtained for this fictitious param centerline for gr oup 1 and about 7mm for group 2 (Fig.9) eter is the one to use for the modeling of the frictional This gave a load-bearing capacity of 14kN for group I and behavior. 19 kN for group 2.respectively.Comparing these results to 21.00 1.00 0.80 0.80 00 0.80 0,40 -0.2 0.40 020 0.20 -0 0.00 -020 -0,20 0.40 -0,40 40 20 roup1 (LOAD 11kN) x-dis nce (mm ARAMIS ziente (bmit 1.00 100 0,80 0,80 0.60 0.60 0.40 0.40 4=0.4 02 0,20 0.00 40.5 0.00 0.20 元-0.40 04 010 20 30 40 20 r2(LOAD 17KN) ce (mm K- (m ≌SpringerHolz Roh Werkst (2008) 66: 363–372 369 Table 2 Results of load-bearing tests Tabelle 2 Ergebnisse der Tragfahigkeitsversuche ¨ Load-bearing Mean capacity capacity COV Group Joint (kN) (kN) (%) 1 1 12.7 13.3 7.6 2 13.4 3 12.3 4 14.6 2 1 19.0 19.1 0.4 2 19.1 3 19.0 4 19.2 Note: COV = Coefficient of variation for example, be that the estimates of µ in this study were made at a load level close to the ultimate capacity of the joints. This was not the case in Rodd (1973). It is most likely so that local plastic deformation occurs in the timber, parallel and perpendicular to the grain, close to the dowel at higher load levels that affect the contact situation. Thus, the coefficients of friction estimated in this study should be considered as fictitious parameters. In numerical simulations, when assuming linear-elastic behavior for the wood, the value obtained for this fictitious parameter is the one to use for the modeling of the frictional behavior. Fig. 6 Strain distributions perpendicular to the grain along the x-axis in the picture at the right: a numerical results where the coefficient of friction (µ) is varied, b experimental results from the ARAMIS-system for each group of joints together with a numerical result for the best fit curve Abb. 6 Dehnungsverteilungen rechtwinklig zur Faser entlang der x-Achse im Bild oben rechts: a numerische Ergebnisse bei unterschiedlichen Reibungskoeffizienten (µ), b mit dem ARAMIS-System ermittelte Versuchsergebnisse der Verbindungen mit einer rechnerisch ermittelten Ausgleichskurve A general observation can be made when studying Fig. 6. It shows that the level of tensile strains perpendicular to the grain is quite similar between the two groups in spite of the fact that the load level is much higher for the group 2 joints. The numerical results in Fig. 6 indicate that the strains are rather uniform for the group 2 joints, but for the group 1 joints instead a peak of tensile strain can be seen. This is the reason why the initial crack was seen only for the group 1 joints. 4.3 Fracture analyses In order to predict the load-bearing capacity of the joints, the same numerical model as used above was adopted. The coefficients of friction (µ) were set to 0.1 and 0.4 corresponding to the results presented above for the group 1 and group 2 joints, respectively. Shear stresses and normal stresses in the tangential direction of the timber were analyzed along different paths starting from the dowel towards the end grain surface. Equations 2–5 were used to find a critical path and estimate the load-bearing capacity. The results showed that this path was located about 2 mm off the dowel centerline for group 1 and about 7 mm for group 2 (Fig. 9). This gave a load-bearing capacity of 14 kN for group 1 and 19 kN for group 2, respectively. Comparing these results to 13